Download
1 / 28
280 likes | 597 Views
Value added with EVM for Senior Level Portfolio Management. LtCol Harold Ennulat Ellen Udell SAF/AQXR 18 Nov 2002. Overview. Roles and Responsibilities of SAF/AQX in the AF Budget Process Earned Value Reporting How Earned Value is used by AF Executives Conclusions.

E N D
Value added with EVM for Senior Level Portfolio Management LtCol Harold Ennulat Ellen Udell SAF/AQXR 18 Nov 2002
Overview • Roles and Responsibilities of SAF/AQX in the AF Budget Process • Earned Value Reporting • How Earned Value is used by AF Executives • Conclusions
Key Budget Functions of SAF/AQX • Reviews financial execution & reallocates resources • Manages all reprogramming for AF Modernization (RDT&E and Procurement) • Orchestrates release of funds on OSD withhold • Coordinates these actions with PEOs and MADs • Provides expert assistance on AF, OSD, and Congressional financial policies and laws • Works With other Headquarters functionals to ensure program funding direction is in compliance with Congressional, OSD, and AF guidance • Manages budget documentation process • RDT&E, Procurement mods and initial spares
Modernization Account StatusModernization / Procurement / RDT&E PBs (BY02$) Year $B % Blue TOA FY85 $66B 49% FY02 $49B 36% FY75 $23B 30% $25.9B 33% FY97 $20B 30% $15.6B 20% $14B 18% $10B 15% FY87 $18B 15% FY74 $9B 12% $10.4B 13% One of every three dollars goes to AF Modernization
Earned Value Reporting • Monthly Acquisition Report (MAR) • Monthly Report to SAF/AQ • Must report for all programs (new policy) • Use estimated percentages for non-earned value contracts • Primary input – cost and schedule variance chart • Defense Acquisition Executive Summary (DAES) • Quarterly Report to OSD for MDAP/ACAT I Programs • Required Quarterly Section 7 - Supplemental Contract Cost Information • Must report for non-FFP contracts receiving EVM data • Primary input – CPR Header and Summary data points
MAR Purpose • Quick-look assessment of program health to SAE • Identifies need for HQ involvement • Focus on Issue, Impact, Way-Ahead • Provides ready reference of current information • HQ data source for cross-program analysis • Used for analysis of contractor mgmt, systemic cost growth drivers, etc • Provides historical reference and basis for consistency in other reports (DAES, SAR, AFPMRS) • Building block for AQ Integrated Digital Environment
PROGRAM NAME Program Short Name ACAT: Phase: Description: Monthly Acquisition Report MONTH YEAR COST Issue Category SCHED Issue Category KPP Issue Category FUND Issue Category OVERALL ISSUE: Describe Issue causing yellow or red IMPACT: - Assess specific programmatic impact - Limit to two or three bullets WAY AHEAD: - List actions being taken or planned Issue Category Acronyms: Spell out program specific acronyms here Y R Y ISSUE: Describe Issue causing yellow or red IMPACT: - Assess specific programmatic impact - Limit to two or three bullets WAY AHEAD: - List actions being taken or planned ISSUE: Describe Issue causing yellow or red in no more than two lines (14 pt) IMPACT: - Assess specific programmatic impact - Limit to two or three bullets WAY AHEAD: - List actions being taken or planned - Include what, when, expected affect - Any action requiring SAE or other participation should be identified (SAE) G G G Y Y Y R R R Y ISSUE: Describe Issue causing yellow or red IMPACT: - Assess specific programmatic impact - Limit to two or three bullets WAY AHEAD: - List actions being taken or planned G ISSUE: Optional when rated green Other Information: (Optional) - Use bullets - Include information on current significant accomplishments, including action, date, and affect - Further clarify issue(s) raised in the above assessment section - Identify issues/concerns not contained above such as future-year funding, contract issues, unit cost concerns, etc. Program Assessment Chart
Data Page • Focus on information • Provides the basis for assessing health • Allows multiple graphs to be produced as needed • Four Sections • Contract Performance (Earned Value) • Classic Cost and Schedule Variances Trend Chart • Provides Graphical Representation of Cumulative cost Variance, Schedule Variance, Management Reserve • All underlying data is also available • Schedule • Upcoming major milestones • Technical Performance • Exception Based: Only report KPPs that are Yellow or Red • Funding Status by appropriation account • Authority, Release, Obligations and Expenditures
SPD: SPD Name Office Symbol DSN: PEO: Brig Gen Name AFPEO/XXXX DSN: PROGRAM NAME Month Year Program Schedule Contract Performance • MS-C DAB / 31 Aug 01 / (SAE / DAE) • Prod Contract Award / 1 Sep 01 • First flight @ Edwards AFB / 5 Dec 01 Performance (KPP) (Unclassified & By Exception) Funding ($M) (Ob/Exp: SPO as of Mar) Syst Weight 52 Lbs 58 Lbs 60 Lbs KPP: Obj: Thresh: Est: KPP: Obj: Thresh: Est: Program Data Chart
Earned Value Analysis from DAES Input Only addresses contract performance, not total program • Usually on Cost Plus type contracts over $6M • Primary purpose of SAF/AQXR analysis is to determine an independent completion cost estimate • Based on cost and schedule performance to date • Compare to Contract Value less Fee (Contract Budget Base) • Compare to Contractor’s and PM’s completion estimate • May also highlight cost and schedule variance issues
Traditional Contract Performance Chart • 3 ideas on chart: • Changes to the contract • Changes to the Estimate • Performance Data
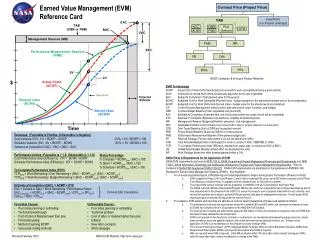
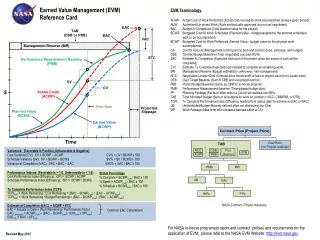
Variances Graph • Purpose: Early warning of funding problems • Compares cost & schedule variances within a +/- 10% control limit. Also plots use of management reserve • Primary value: Expect cost and schedule variances to be within the 10% variance bands. • If overrunning at 15-20% complete -- will finish that way • CV% will not improve by more than 10% (10% Rule) • Secondary value: Track Management Reserve Usage • Early use of MR may suggest poor planning, and masks CV • Secondary value: Estimate variance at completion: • Straight Line Method: extrapolate the CV to the completion time to determine the potential overrun • Tertiary value: shows re-baselines • Resetting of CV and SV to 0 (saw tooth effect)
Example:MOH-2 Cost and Schedule Variance Trends Cost/Schedule Variance Trends F33298-99-C-0010 RDTE CPAF Contractor: Mega Hertz Program: Contract: MOH-2 AS OF: OCT 01 20.0 Start Complete 10.0 Dollars In Millions 0.0 -10.0 -20.0 -30.0 -40.0 1997 1998 1999 2000 2001 2002 2003 2004 Cost Variance 1.8 Cost Var Est @ Completion Schedule Variance -1.2 10% Thresholds PO -33.1 Management Reserve 7.3 Start/Comp Dates CTR 0.0
Performance ReviewCost and schedule efficiency (Compared to plan) Baseline: $20,796.2K (w/out fee) Completion Estimate: $20,761.0K % Complete: 33 % Spent: 35 Cost Schedule Adequate Performance -$428K Efficiency Developing Problems -$499K Significant Problems Contract: MOH-2 Ktr: Mega Hertz (CPAF) as of Jan 93
EAC Graph • Purpose: Tests realism of completion estimates • Compares baseline Budget at Completion (BAC) to Contractor's Estimate at Completion (EAC) using Cumulative CPI as a control measure • Primary value: EAC should be at or above Cum CPI • Statistically, Cum CPI forecast represents the LOWEST cost at which a contract will complete • EAC’s below Cum CPI should be questioned for believability • Secondary value: Does contract have enough money? • If contract is experiencing unrecoverable costs, EAC should be higher than BAC • Additionally, BAC’s lower than Cum CPI indicate need for money
EAC Graph • Another realism test for completion estimates is TCPI vs CPI • TCPI and CPI should be within 5% of each other for a believable Completion Estimate. • If differ by more than 10% the Estimate is underestimated • TCPI can be based on both the Budget or the Estimate TCPI: To-Complete Cost Performance Index TCPI is an indicator of how efficient the contractor needs to be from now on in order to finish the contract at the BAC or EAC. Since CPI reflects the historical efficiency, it is very difficult to make large changes between the two. BAC - BCWP TCPI = EAC - ACWP TCPI is the CPI of the remaining work
Traditional Cost Variance/EAC Analysis Chart (CPI Chart) Useful data to predict whether the contract will come in at estimate.
Traditional EAC Realism Chart (EAC Chart Modified to Include Cum CPI) Useful data to assess the believability of the PM or Contractor’s estimate to complete.
( ) CPICUM TCPIBAC 1 x 100 Confidence in Contract ValueWill contract complete at baseline value? Baseline: $20,796.2K (w/out fee) Completion Estimate: $20,761.0K % Complete: 33 % Spent: 35 Potential Cost Under Run Acceptable Percent Difference Current Efficiency / Required Efficiency Potential Cost Over Run Cost Over Run Contract: MOH-2 Ktr: Mega Hertz (CPAF) as of Jan 93
( ) CPICUM TCPIEAC 1 x 100 Confidence in EstimateWill contract complete at contractor’s current estimate? Baseline: $20,796.2K (w/out fee) Completion Estimate: $20,761.0K % Complete: 33 % Spent: 35 No Confidence Questionable Acceptable Percent Difference Current Efficiency / Required Efficiency Questionable No Confidence Contract: MOH-2 Ktr: Mega Hertz (CPAF) as of Jan 93
Expected Completion Estimate • Comparison of Contract Budget Baseline (CBB) to Contractor, PM and SAF/AQXR Completion Estimates • CBB = Contract Value less Fee • May include Over Target Baseline (OTB) data • Exception basis for contracts with large cost overruns to date • For Earned Value purposes only, the value of the Work Plan is set higher than the CBB. Not a contractual change • Remaining work is replanned and cost and schedule variances usually reset to 0 • Definite contract cost overrun of at least the OTB amount • If root cause not corrected, overrun could be even higher
Example:B-1 CMUP DSUP - Expected Completion Estimate Contract Budget Baseline: Mega Hertz Estimate: PM Estimate: AQXR Low: AQXR High: % Complete: 33 $20.8M $20.7M $22.0M* $22.4M $23.1M $20 $22 $24 * PM’s estimate includes all items currently on contract, as well as estimated additional costs for future contract modifications expected due to GFE delays and reduced raw materials availability. Mega Hertz and AQXR estimates include only those items currently on contract.
Sample Program - EVMS Issues • Cost variance trend continues to degrade • Contractor and SPO completion estimates statistically unrealistic. • Completion estimates assume remaining work will be performed at a cost efficiency of 1.04 • Historical Cost efficiency • To date = 0.932 3-month avg = 0.951, 6-month avg = 0.915 • Work remaining = $13.9M • Cost to complete estimate = $13.4M • AQXR Questions: • Contractor has historically performed all work at higher cost than planned • Completion estimate assumes all remaining work can be completed for less than planned costs • Assuming the estimates are realistic, and all cost variances to date are unrecoverable, what measures are in place to complete the remaining $13.9M of work for $13.4M?
Portfolio Evaluation XX Portfolio Ahead Of Sched Cost Overrun Ahead Of Sched Cost Underrun Pgm H PM Action Pgm A Pgm B Pgm C MOH-2 Pgm E Pgm H Pgm F Pgm G Pgm G Pgm F Pgm C Pgm E MOH-2 PEO Action Pgm A SAE Action Pgm B Behind Sched Cost Underrun Behind Sched Cost Overrun
Other Uses for EV • Crosscut Analysis • Evaluate management between portfolios • Evaluate management between contractors • Identify Systemic Management Problems • Poor Cost Estimating • Requirements Creep • Funding Instability • Technical Risk • Economic Assumptions • Poor Management (Uncontrolled cost/schedule growth)
Conclusion: Role of Earned Value in Portfolio Management • Place importance on solid program management • Baseline management is key • Why should I believe your EAC? • What is the biggest impediment on your critical path? • Impact of Contract Performance (Earned Value) on funding • Will this program create either a bill (overrun) or source (underrun) for current year execution? • Programmatic decisions are based on historical data, latest Earned Value data and Obligations & Expenditures Executives Role: Drive Organizational Behavior – Earned Value helps!