Download
1 / 18
180 likes | 223 Views
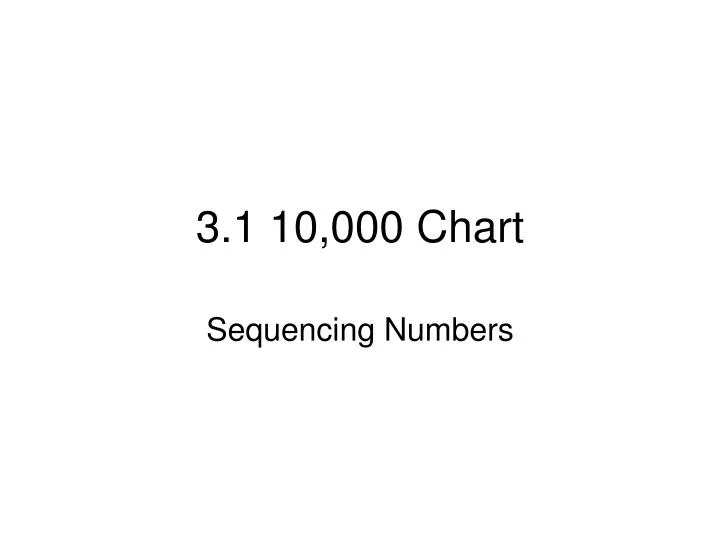
3.1 10,000 Chart. Sequencing Numbers. Solve Mentally. 7,805 What is 7,805 + 2,000? _______ What is 7,805 + 5,000? _______ 7,805 – 3,000?______ 7,805 + 200?_______ 7,805 – 300? __________ Which places have the same digits? Which do not? Why?. Guiding Questions.

E N D
3.1 10,000 Chart Sequencing Numbers
Solve Mentally • 7,805 • What is 7,805 + 2,000? _______ • What is 7,805 + 5,000? _______ • 7,805 – 3,000?______ • 7,805 + 200?_______ • 7,805 – 300? __________ • Which places have the same digits? Which do not? Why?
Guiding Questions • How can understanding place value help you solve addition and subtraction problems with larger numbers?
Practicing Place Value • 8,435 + 5,000 • Solve the problem. • How did you decide what the sum is? • What do you notice about the digits in each place? • What is the value of each digit?
Chart • Just by looking at the chart, about how many squares do you think are on these charts? Why? Turn & Talk • Can you figure out exactly how many squares are n the chart? How do you know?
Visualize • Visualize numbering each square of the chart: • What would happen if we numbered every square from 1 to 10,000, going all the way across the first row, then starting at the beginning of the second row and numbering all the way across, and so on?
Predicting • What number should go in the first square in the upper left hand corner? • What number should go in the last square in the bottom right hand corner? • Number those squares • About where would you expect the number 50 to go? 100?
Thinking…. • Suppose you want to find a specific number on the chart. We could write in every number, but that would take WAY long! So, each group is going to decide on some LANDMARK numbers (ones you feel are important so you can quickly find the number for any square on your chart). • Turn & Talk about some landmark numbers.
Share Your Ideas • What are some landmark numbers we should list? Let’s list them! • How many of each would you have to write?
Write Your Landmark Numbers • On your charts, go ahead and write in your landmark numbers. • Can you say what number would be one row below one of your numbers? 3 rows below? 2 rows above? • What are you doing when you move up the chart? Down the chart? Forward and backward on the chart?
Explore • Select a landmark number. Then explore the following ideas: • What number is one less than that? • What number is 10 less? • What number is 10 more? • What number is 100 less?
Adding & Subtracting • Everyone find 1,250 on your chart. • What number is 5 rows below that? Turn & talk, then locate that number on your chart. • New Number _______________ What operation did you perform by moving below 1, 250?
Addition & Subtraction • Go back to 1,250. How many rows above that number is 950? Turn & talk. • How many rows did you move up? How did you know that? • 1,250 - ______ = ________.
Addition & Subtraction • Go back to 1, 250. What number is 75 more? Turn & talk, then point to the new number. • The numbers increase when moving _____________________ and _________________.
Labeling • Label the following on your chart: 9,970 3,770 1,508 5,020 8,854 7,305 2,965 6,351 7,642 2,020 9,033 4,139 1,215 3,290 6,897 4,786 115 490 8,460 5,645
Assignment • Find each number below, and write the equation that shows the addition or subtraction (on notebook paper). Label the new square on the 10,000 chart. This is a group project, but each of you must turn in a sheet • What number is: • 1 row below 750 • 5 rows below 750 • 12 rows below 750 • 4 rows above 750 • 40 rows below 750
Wrapping Up • How does the structure of the chart help you answer these problems? • What was easy? • What was hard?
Guiding Questions • How can understanding place value help you solve addition and subtraction problems with larger numbers?