Download

1 / 27
270 likes | 274 Views
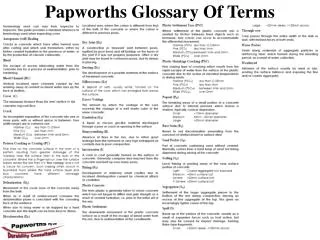
This PowerPoint presentation explains the AQA Glossary of Terms for ISA preparation, covering variables, hypothesis, validity, data, calibration, resolution, true value, uncertainty, measurement error, precision, anomalous results, random errors, zero errors, systematic errors, and ranges.

E N D
ISA Glossary of Terms Use this PowerPoint to help you explain the AQA Glossary of Terms in preparation for an ISA for the 2011 course. W Richards Education Using PowerPoint
Variables Variables can be described in a number of ways: 1) Categoric – categoric variables have values that are labels, e.g. eye colour 2) Continuous – continuous variables have a numerical value, e.g. the number of pets you have or your height 3) Control – a control variable is one that could affect the outcome of the experiment but you keep it the same 4) Independent – the independent variable is the one that you will change during your experiment 5) Dependent – the dependent variable is the one that will be measured after changing the independent variable
A Hypothesis and a Prediction Put simply, a prediction “predicts” the future whereas a hypothesis is a proposal designed to explain some observations. For example, consider an experiment on acid reacting with marble: I think that a stronger acid will cause the marble to react quicker. Here’s my data. I think that this data shows that there is a relationship between the strength of the acid and the rate of reaction. Which one is a prediction and which one is a hypothesis?
Validity, Fair Tests and Evidence For an experiment to be “valid” it must be a fair test, e.g: I’m investigating how quickly acid reacts with marble chips. I want to know if the concentration of the acid affects the reaction rate. Here are my results: Clearly, the stronger the acid, the quicker the reaction. Was this experiment valid? Was it a fair test? Can this data be classed as “evidence”?
Data Here are my results. I think I’ll draw a graph of them as this is “quantitative data”, e.g. the number of people who have different hair colour. I’ve also got some results but mine are descriptive or written in words – this is “qualitative data”, e.g. my hair colour.
Calibration I want to use this big tube as a thermometer. How could I do it? Step 1: Mark where a liquid would be at a known value, e.g. 100OC Step 2: Mark where the liquid would be at a second known value, e.g. 0OC Step 3: Mark on a scale by dividing the length by 100 sections – each section represents 1OC. Now it is calibrated!
Calibration Here’s another example of using a known quantity to calibrate something:
Resolution You have a choice of two thermometers: What is the resolution of each thermometer? What is the resolution of the stopwatch used in the experiment below?
True Value and Accuracy The “true value” is the value that would be obtained with ideal measurements. A measurement is judged to be “accurate” if it close to that value. For example, what does this thermometer read? I reckon it’s 22OC I reckon it’s 24OC My measurement was the most accurate as it was closest to the true value! I reckon it’s 26OC
Uncertainty Consider the same thermometer readings again: Is it 22OC, 24OC or 26OC? “Uncertainty” means “the interval within which the true value would lie” with a given level of probability, e.g. “the temperature is 24OC ± 2OC, to within a probability of 95%”.
Measurement Error A “measurement error” is defined as “the difference between a measured value and the true value”, e.g: Here’s my friend. I’ve just measured him with a metre ruler and I think he’s 170cm tall. Unlucky. I’m actually 175cm tall. What is the difference between these results and what is the percentage difference between them?
Precision “Precise measurements” are measurements that show very little spread around the mean average value. Which of the following two sets of data are the most precise? Notice that precision depends only on random errors – it gives no indication of how close results are to the true value!
Anomalous Results Here’s a graph that shows us how the temperature of hot water varies when it is left in a cold room. What would you do with these results? Temperature of water/OC x x x x x x x x 0 Time/mins
Random errors Random errors can occur with any experiment but some experiments can have more random errors than others. For example, here are two experiments: Hooke’s law, where different forces are hung on a spring and the extension is measured. Choice chambers, where woodlice are “invited” to choose their living conditions. Which one of these experiments would probably have the most random errors and what would do about it?
Zero Errors What’s wrong with this balance reading?
Systematic Error A systematic error is one where the measurement differs from the true value by a consistent amount each time, e.g: Notice that a zero error usually results in a systematic uncertainty.
Systematic Errors on a Graph x x x x x x x x Resistance of wire/Ω According to this graph, a wire that’s zero cm long has some resistance, which can’t be right. What went wrong? Length of wire/cm 0
Ranges and Intervals “Range” represents the range from the lowest and highest values for a variable. “Interval” represents the quantity between readings. For example, consider the following experiment: What is the range and interval of these lengths?
“Repeatable” and “Reproducible” Here are my results sir. I did the experiment 3 times using the same method and equipment and got the same results each time. Here are my results sir. I followed the same method as my friend and got the same results. This data is judged to be “reliable” as it stayed the same after several different measurements. Q. Which experiment shows “repeatable” data and which one shows “reproducible” data?
Drawing a conclusion Here’s a simple experiment where the rate of cooling is investigated when hot water is covered in different numbers of layers:
Writing a valid conclusion A bad conclusion: A simple statement saying what your results show. A good conclusion: A detailed statement showing what your results show AND a description of other patterns, e.g. what happens between 4 and 5 layers of insulation? Why did this happen? Is your graph a straight line or a curve? Do your results show proportionality? If the experiment was designed well, the data is valid (i.e. from a fair test) and the conclusion accurately explains what the data shows then we call the conclusion “valid”
Drawing a conclusion x x x x x x x x Temperature of water/OC x 3 layers x x x x x x x No layers 0 Q. What would be a good conclusion for these results? Time/mins
Anomalous Results Where are the two anomalous results and what caused them?
Calculating mean values • To calculate the mean value of a range of results, follow the following steps: • Add the numbers up • Press the equals button • Divide by how many numbers you added For example, calculate the mean average of the following: • 8, 10, 12 • 104, 106, 88 • 34, 56, 40
Sketch Graphs A sketch graph is one that “sketches” the relationship between two different variables without plotting any points. For example: Sketch a graph to show how the temperature of a hot cup of coffee will change over time: Sketch a graph to show how the rate of CO2 produced during photosynthesis varies with temperature: Temperature of water/OC 0 0 Time/mins
Which graph? Line graphs Bar charts Used for “continuous” variables, e.g. height, weight, length, temperature, time etc Used for “discrete” or “categoric” variables, e.g. number of people, eye colour etc
This slideshow has been made freely available on the TES Resources website. More Science PowerPoints like this can be found at the website www.educationusingpowerpoint.com. This site contains slideshows that cover the 2011 AQA, EdExcel, OCR Gateway and OCR 21st Century courses (with more material being added every year) and A Level Physics and KS3 material. Some slideshows are free, others require a small subscription fee to be taken out (currently only £50 for a year). Further details can be found at Education Using PowerPoint.