Download
1 / 33
330 likes | 428 Views
Interest Grabber. Section 3-1. Levels Within Levels.

E N D
Interest Grabber Section 3-1 Levels Within Levels • An ecosystem is a collection of all the organisms that live in a particular place, together with their nonliving, or physical, environment. Within an ecosystem, there are several levels of organization. Your school and its grounds are similar to an ecosystem.
Interest Grabber continued Section 3-1 • 1. What living things are found in and around your school? • 2. What nonliving things are found in your school? • 3. Into what large groups are the students in your school divided? • 4. Into what smaller groups are these large groups divided? • 5. Are these groups ever divided into even smaller groups? If so, what are these groups?
Section Outline Section 3-1 • 3–1 What Is Ecology? A. Interactions and Interdependence B. Levels of Organization C. Ecological Methods 1. Observing 2. Experimenting 3. Modeling
Field site Experimental plots, field sites, laboratory Many sites for data collecting Tapes, compass, Global Positioning System, thermometer, sensors Tapes, compass, Global Positioning System, thermometer, sensors Aerial views, Global Positioning System, weather balloons Binoculars, microscope, telescope Satellite images Binoculars, microscope, telescope Notes, automated data storage Notes, automated data storage Automated data storage Test kits Test kits Large database, multiple sensors Mathematical analysis and graphics, statistics Mathematical analysis and graphics, statistics Mathematical analysis and graphics, statistics, simulations Compare/Contrast Table Section 3-1 Ecological Methods Observation Experiment Model Building Sites Measuring Tools Magnifying Tools Written Record Chemical Testing Computer/ Calculators
Figure 3-2 Ecological Levels of Organization Section 3-1 Community= interacting populations Ecosystem= all the organisms that live in a place, together with their nonliving environment Biotic – Abiotic Biome= a group of ecosystems that share similar climates and typical organisms Species = organisms that can interbreed and produce fertile offspring
Interest Grabber Section 3-2 Pass It Along • Energy flows in one direction through an ecosystem, from the sun or inorganic compounds to producers (organisms that can make their own food) through various levels to consumers (organisms that rely on other organisms for food). Your body gets the energy and materials it needs for growth and repair from the foods you eat.
Interest Grabber continued Section 3-2 • 1. Make a list of five foods that you like to eat. Indicate whether the food comes from a plant (producer) or an animal (consumer). • 2. Like many birds, chickens eat grains, which are seeds. Where do seeds come from? • 3. Meat comes from beef cattle. What do cattle eat? • 4. Construct a diagram showing how one of your favorite foods obtains its energy. Include as many levels as you can.
Section Outline Section 3-2 • 3–2 Energy Flow A. Producers 1. Energy From the Sun 2. Life Without Light B. Consumers C. Feeding Relationships 1. Food Chains 2. Food Webs 3. Trophic Levels D. Ecological Pyramids 1. Energy Pyramid 2. Biomass Pyramid 3. Pyramid of Numbers
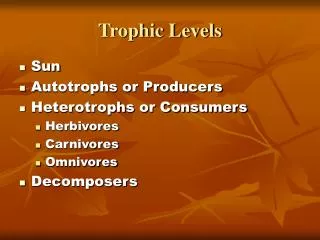
Producer = autotroph • Consumer = heterotroph • Omnivore • Trophic Level
A food web may be complex with many different organisms at each level
Figure 3-8 A Food Web Section 3-2
Scavengers and decomposers make detritus Detritus eaten by detritivores Decomposer
Plant material eaten by caterpillar 200 J Cellular respiration 67 J 100 J Feces 33 J Figure 54.10 Growth (new biomass) Production Efficiency • When a caterpillar feeds on a plant leaf • Only about one-sixth of the energy in the leaf is used for secondary production
Tertiary consumers 10 J Secondary consumers 100 J Primary consumers 1,000 J Primary producers 10,000 J Figure 54.11 1,000,000 J of sunlight Pyramids of Production • This loss of energy with each transfer in a food chain • Can be represented by a pyramid of net production
Dry weight (g/m2) Trophic level Tertiary consumers 1.5 Secondary consumers 11 37 Primary consumers Primary producers 809 (a) Most biomass pyramids show a sharp decrease in biomass at successively higher trophic levels, as illustrated by data froma bog at Silver Springs, Florida. Figure 54.12a • Most biomass pyramids • Show a sharp decrease at successively higher trophic levels
Ecological Pyramids Section 3-2 Energy Pyramid Shows the relative amount of energy available at each trophic level. Organisms use about 10 percent of this energy for life processes. The rest is lost as heat. Pyramid of Numbers Shows the relative number of individual organisms at each trophic level. Biomass Pyramid Represents the amount of living organic matter at each trophic level. Typically, the greatest biomass is at the base of the pyramid.
Interest Grabber Section 3-3 It’s Raining, It’s Pouring • How many times have you had to change your plans because of rain? It probably didn’t help if someone tried to cheer you up by saying, “But we really need the rain.” • However, rain is important. If it didn’t rain, how would living things on land get water?
Interest Grabber continued Section 3-3 • 1. When rain falls on the ground, it either soaks into the soil or runs across the surface of the soil. When rainwater runs across the land, what body of water might collect the rain? • 2. From here, where might the water flow? • 3. After the rain, the sun comes out and the land dries. Where does the water that had been on the land go? • 4. Construct a diagram that would illustrate all the places a molecule of water might go. Begin with a raindrop and end with a cloud.
Section Outline Section 3-3 • 3–3 Cycles of Matter A. Recycling in the Biosphere B. The Water Cycle C. Nutrient Cycles 1. The Carbon Cycle 2. The Nitrogen Cycle 3. The Phosphorus Cycle D. Nutrient Limitation
Evaporation Transpiration The Water Cycle Section 3-3 Transpiration Water taken up by plants evaporate off of leaves Condensation Precipitation Runoff Seepage Root Uptake
Figure 3-13 The Carbon Cycle Section 3-3 CO2 in Atmosphere CO2 in Ocean
Figure 3-14 The Nitrogen Cycle Section 3-3 Nitrogen Fixation Nitrogen from the air (N2) is converted into a form that plants can use (NO3- and NO2-) Usually nitrogen fixing bacteria in the soil does this N2 in Atmosphere NO3- and NO2- NH3
Nutrient Limitation Nutrients may only be available is small quantities and limit plant growth. Typically if Phosphorus is added to an aquatic ecosystem there is an algal bloom – which is an overpopulation of algae in an area.
Video Video Cycles in Nature • Click the image to play the video segment.
Go Online Internet • The latest discoveries in preserving the environment • Links from the authors on exploring ecology from space • Interactive test • For links on energy pyramids, go to www.SciLinks.org and enter the Web Code as follows: cbn-2032. • For links on cycles of matter, go to www.SciLinks.org and enter the Web Code as follows: cbn-2033.
Interest Grabber Answers Section 1 Answers • 1. What living things are found in and around your school? • Living things in the school are students, teachers, principal, assistant principals, clerical staff, custodians, lunchroom staff. Students may also include animals in science labs. Living things around the school include grass, trees, shrubs, insects, birds, and so on. • 2. What nonliving things are found in your school? • The building, furniture, desks, books, papers, and so on • 3. Into what large groups are the students in your school divided? • 9th, 10th, 11th, 12th grades, or years • 4. Into what smaller groups are these large groups divided? • Classes • 5. Are these groups ever divided into even smaller groups? If so, what are these groups? • Students may say that science classes are divided into lab groups; other classes may be divided into groups for projects.
Interest Grabber Answers Section 2 Answers • 1. Make a list of five foods that you like to eat. Indicate whether the food comes from a plant (producer) or an animal (consumer). • Student lists will be individualized. One possible example would be a hamburger, which comes from a cow or steer. • 2. Like many birds, chickens eat grains, which are seeds. Where do seeds come from? • Seeds come from plants. • 3. Meat comes from beef cattle. What do cattle eat? • Cattle eat grass or grains. • 4. Construct a diagram showing how one of your favorite foods obtains its energy. Include as many levels as you can. • Student diagrams will be individualized based on their food choice. Using the hamburger example, the beef in the hamburger comes from cattle. The cattle feed on grass or grain. Grass or grains are plants, which use energy from the sun to make their own food.
Interest Grabber Answers Section 3 Answers • 1. When rain falls on the ground, it either soaks into the soil or runs across the surface of the soil. When rainwater runs across the land, what body of water might collect the rain? • Possible answers: a stream, river, pond, or lake • 2. From here, where might the water flow? • Into a river, and eventually into the ocean • 3. After the rain, the sun comes out and the land dries. Where does the water that had been on the land go? • It evaporates and becomes a gas in the atmosphere. • 4. Construct a diagram that would illustrate all the places a molecule of water might go. Begin with a raindrop and end with a cloud. • Student diagrams may include the following: a raindrop —> lawn —> a stream —> river —> large lake —> atmosphere —> cloud.
End of Custom Shows • This slide is intentionally blank.