Download
1 / 10
100 likes | 147 Views
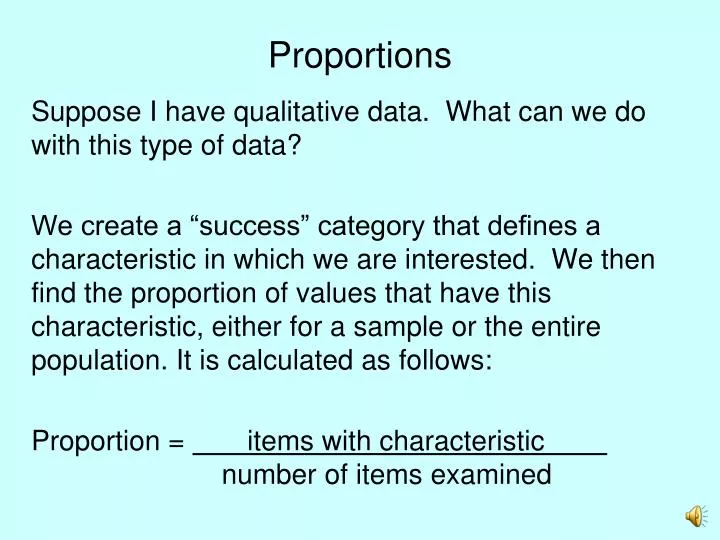
Proportions. Suppose I have qualitative data. What can we do with this type of data?

E N D
Proportions Suppose I have qualitative data. What can we do with this type of data? We create a “success” category that defines a characteristic in which we are interested. We then find the proportion of values that have this characteristic, either for a sample or the entire population. It is calculated as follows: Proportion = items with characteristic number of items examined
Notation for Proportions If we are talking about the entire population, the proportion we find is the parameter and is given the symbol p. Note that this is NOT Geometry, so the value of the Greek letter Pi is NOT 3.14159… If we are talking about a sample proportion, we use the letter p. Just as might use to estimate m, we will use the statistic p to estimate the parameter p.
Sampling Distribution of p We need to know what the statistic’s sampling distribution looks like (center, variability, normal?). Suppose that 20% of all people in this area have brown hair. (So p = 0.20) A sample of 100 people is taken and 24 have brown hair. So p1 = 24/100 = 0.24. A second sample of 100 people is taken and 19 have brown hair. So p2 = 19/100 = 0.19. Do this for 100,000 different samples.
Sampling Distribution of p If I make a histogram of the 100,000 different sample proportions (p1, p2, …, p100,000), what patterns would I see? 1. Center: The mean of all sample proportions is 0.20 Notice the “center” is the value of the parameter, which makes sense. Some statistics will be higher than the parameter, some will be lower. But on average, they are centered at p.
Sampling Distribution of p If I make a histogram of the 100,000 different sample proportions (p1, p2, …, p100,000), what patterns would I see? 2. Variability: (Keep 6 digits after the decimal point) How different can the sample proportions be? The reasons are beyond what we cover in the class, so you just need to use the formula and “trust me!”
The Sampling Distribution of p 3. The sampling distribution of the sample proportion is approximately normal whenever both of the following conditions are true: i. p – 3 is more than 0 ii. p + 3 is less than 1 This ensures the distribution lies between 0 and 1.
The Sampling Distribution of p We can then talk about probabilities if the third point suggests that the sampling distribution is normal. We create a z-score using the formula Again, if the probability is less than .05, the value of the sample proportion is unusual.
Example A report claims that 68% of all Americans spent $800 or more on gifts during the last holiday. A random sample of 250 people in Cincinnati reveals that 180 spent $800 or more for gifts. A. Fully describe the sampling distribution of the sample proportion for 250 people assuming the report is true. B. Would it be unusual to see the results observed for the people of Cincinnati if the report is true?
Solution to Part A 1. Center 0.68 2. Variability 3. Normal? i. 0.68 – 3(.029503) = .591 which is more than 0 ii. 0.68 + 3(.029503) = .769 which is less than 1 Since both conditions are satisfied, the sampling distribution of p is normal.
Solution to Part B Now p = 180/250 = 0.72 for the random sample. Since .72 is more than .68 (the value of p), we want to find the chance that any value of p is .72 or more. First, convert .72 into a z-score. Now find P(Z > 1.36) = 0.5 – 0.4131 = .0869 Since .0869 is not less than .05, we do not consider seeing 180 out of 250 people who spent more than $800 to be unusual. We don’t doubt that p = 0.68.