Download
1 / 23
230 likes | 371 Views
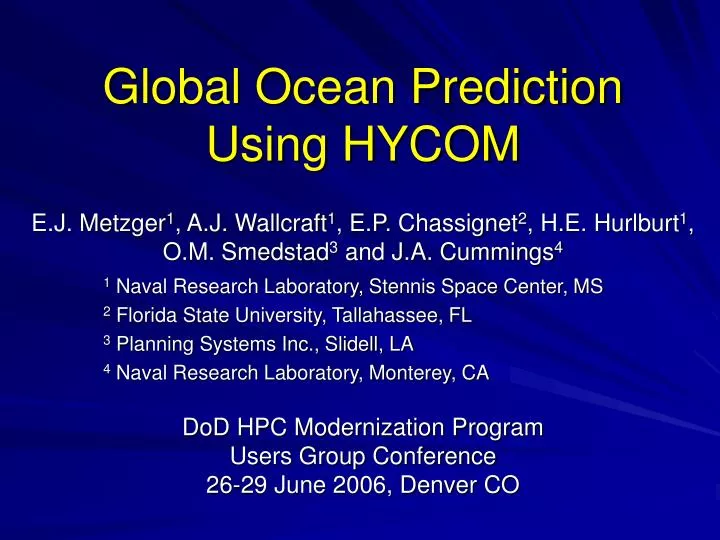
Global Ocean Prediction Using HYCOM. 1 Naval Research Laboratory, Stennis Space Center, MS 2 Florida State University, Tallahassee, FL 3 Planning Systems Inc., Slidell, LA 4 Naval Research Laboratory, Monterey, CA.

E N D
Global Ocean PredictionUsing HYCOM 1 Naval Research Laboratory, Stennis Space Center, MS 2 Florida State University, Tallahassee, FL 3 Planning Systems Inc., Slidell, LA 4 Naval Research Laboratory, Monterey, CA E.J. Metzger1, A.J. Wallcraft1, E.P. Chassignet2, H.E. Hurlburt1, O.M. Smedstad3 and J.A. Cummings4 DoD HPC Modernization Program Users Group Conference 26-29 June 2006, Denver CO
HYCOM – HYbrid Coordinate Ocean Model • Developed from MICOM by HYCOM/NOPP Consortium • Naval Research Lab, U. Miami, FSU, Los Alamos → GISS • Creating a true community ocean model • Hybrid (generalized) vertical coordinate • Isopycnal in open, stratified ocean • Terrain-following in shallow coastal regions • Z-level in mixed layer and other unstratified regions • Generalized – not limited to these types • Dynamically smooth transition between coordinate systems • Coordinate choice varies in space and time • Isopycnals intersecting sloping topography by allowing zero thickness layers • Accurate transition between the deep and shallow water • Existing mixed layer options • KPP Mellor-Yamada 2.5 GISS • Kraus-Turner Price-Weller-Pinkel HPC UGM 2006
100 m South China Sea Warm Current 200 m 300 m South China Sea Branch off the Kuroshio 400 m South China Sea Warm Current Feeding the Taiwan Current Mean Zonal Velocity vs. Depth (top 500m) Along 117°E Layer 1 speed with currents overlaid Taiwan blue = westward,orange = eastward China Pacific Ocean HYCOM makes an accurate transition between the deep and coastal waters and can realistically simulate both South China Sea Philippines m/s
HYCOM Long-term Goals for Operational Ocean Prediction • 1/12° fully global ocean prediction system (~7 km mid-latitude) transitioned to NAVOCEANO in 2007 • Include shallow water, minimum depth 5 m • Coupled sea-ice model (Los Alamos CICE) • Data assimilation (NCODA) • Increase to 1/25° resolution globally (~3-4 km mid-latitude) by the end of the decade • Optimal resolution for basin-scale • Boundary conditions for coastal models HPC UGM 2006
Global HYCOM Configuration • Horizontal grid: 1/12° equatorial resolution • 4500 x 3298 grid points, ~6.5 km spacing on average, ~3.5 km at pole • Mercator 79°S to 47°N, then Arctic dipole patch • Vertical coordinate surfaces: 32 for σ2* • GISS mixed layer model • Thermodynamic (energy loan) sea-ice model • Surface forcing: wind stress, wind speed, thermal forcing, precipitation, relaxation to climatological SSS • Monthly river runoff (986 rivers) • Initialize from January climatology (GDEM3) T and S, then SSS relaxation from PHC 3.0 • No subsurface relaxation to climatology HPC UGM 2006
1/12° Global HYCOM Sea surface height and ice (gray) • Running at NAVOCEANO on IBM Power 4+ (kraken) • 216K CPU hrs/model year on 784 processors • 3.1 Tb/model year for (compressed) daily 3-D output
Long-term Mean Global Sea Level 1992-2002 Mean Dynamic Ocean Topography (0.5°) The 1992-2002 mean ocean dynamic topography data has been obtained from Nikolai Maximenko (IPRC) and Peter Niiler (SIO)
Long-term Mean Global Sea Level 1/12° global HYCOM 5 year model mean using climatological ECMWF wind and thermal forcing HYCOM mean shifted by 10 cm
1/12° Global HYCOM Mean Gulf Stream and Kuroshio pathways Mean over five model years ERA15 climatological wind & thermal forcing
Sea Surface Height (SSH) VariabilitySatellite altimetry (top) vs. 1/12° global HYCOM (bottom) 1992 – 2005 SSH variability based on T/P, ERS-1, and ERS-2 altimeters SSH variability from 1/12° global HYCOM σ2* with climatological wind and thermal forcing Global HYCOM is reproducing the expected eddy structure
Velocity Cross-section Along Luzon Strait Sb-ADCP data (top) vs. 1/12° global HYCOM (bottom) in the upper 300 m Section along 21°N between 118.5°E and 124.0°E 100 200 300 100 200 m/s 300 122°E 123°E 124°E 119°E 120°E 121°E Cross-section overlaid on mean currents and speed Sb-ADCP data from Liang et al. (2003, DSR Pt. II) Mean from HYCOM with ERA15 wind and thermal forcing No ocean data assimilation in HYCOM
Velocity Cross-section East of Taiwan Sb-ADCP data (top) vs. 1/12° global HYCOM (bottom) in the upper 300 m Sections at 22°N (left) and 25°N (right), Taiwan coast to 124°E 100 200 300 100 200 300 m/s Cross-section overlaid on mean currents and speed Sb-ADCP data from Liang et al. (2003, DSR Pt. II) Mean from HYCOM with ERA15 wind and thermal forcing No ocean data assimilation in HYCOM
Velocity Cross-section Along the Equatorial PacificTOGA TAO data (left) vs. 1/12° global HYCOM (right) in the upper 400 mSection between 143°E and 95°W TOGA TAO data from Johnson et al. (2002, Prog. Oceanogr.) 5 year mean from HYCOM using high-frequency ECMWF winds and thermal forcing No ocean data assimilation in HYCOM
median rmsd = 4.4 cm median r = 0.85 Coastal/Island Sea Level Comparison From 1/12° Global HYCOM 2003 statistics at 126 tide gauge stations RMS Difference Correlation Global HYCOM is reproducing the deterministic response to the wind-driven circulation HPC UGM 2006
SST Response in 1/12° Global HYCOM to Hurricanes Katrina and Rita NDBC buoy 42040 south of Mobile Bay NDBC buoy 42036 SE of Pensacola RMS = .67°C R = .89 RMS = .56°C R = .95 HYCOM reproduces the deterministic SST response to the wind forcing. Implies realistic upwelling and mixing of subsurface waters as well as realistic atmospheric wind and heat flux forcing in HYCOM. HPC UGM 2006
One-way File-based Coupling Between HYCOM and CICE (PIPS 3.0) Sea Ice Concentration (%) - September 2003 CICE stand-alone (no ocean) CICE with HYCOM forcing SSMI observations Too much ice Coupling between the ocean and ice models more properly accounts for the momentum, heat and salt fluxes at the air/sea interface HPC UGM 2006
ESMF-based Coupling Between .72° Arctic HYCOM and CICE Sea Ice Thickness (m) and Drift - September 2003 File-based coupling ESMF-based one-way coupling HPC UGM 2006
NRL Coupled Ocean Data Assimilation (NCODA) Ocean obs Sequential Incremental Update CycleAnalysis-Forecast-Analysis SST: GAC/LAC MCSST, GOES, Ship, Buoy Profile: XBT, CTD, T & S profiling Floats (ARGO), Fixed Buoy, Drifting Buoy Altimeter SSHA SSM/I Sea Ice Ocean data QC Innovations Ocean data Analysis 3D MVOI & Cooper-Haines Increments Ocean model HYCOM Forecast Fields Prediction Errors First Guess MVOI - simultaneous analysis 5 ocean variables temperature, salinity, pressure, velocity (u,v)
Data Assimilation SubregionsOverlaid on SSH valid at 5 January 2004 HPC UGM 2006
Data Assimilation in Global HYCOMGulf Stream SSH with SST-based frontal analysis overlaid ← Initial state 1 January 2004 After five assimilation cycles ↓ 5 January 2004 Frontal analysis < 4 days old = white, analysis ≥ 4 days old = black
Sea Surface Height Increments (top)and Observation Locations (bottom) 1 January 2004 5 January 2004 -.3 -.2 -.1 0 .1 .2 .3 m Lines: altimeter tracks; black dots: in situ observations
Future Plans • FY06: • Final non-assimilative spin-up experiment (with improved wind/thermal forcing and CICE) • Multiple data-assimilative experiments over the period May 2001 – June 2002 to tune and refine the assimilation technique • May 2001 to present data-assimilative hindcast • Start a near real-time runs that mimic the expected operational procedure HPC UGM 2006
Future Plans • FY07: • Continue May 2001-June 2002 experiments, some with “advanced” assimilation • Complete a 1993-present “ocean reanalysis” by running a data-assimilative hindcast from 1993 up through May 2001 • Two non-assimilative simulations: • 1995-2007 NOGAPS forcing • 1979-2006 ECMWF forcing • Ten year 1/25° Atlantic demonstration HPC UGM 2006