Download
1 / 34
340 likes | 450 Views
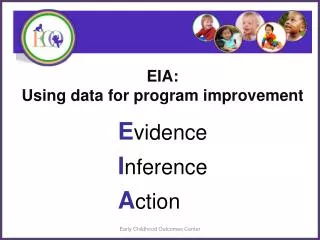
Using Data for Program Improvement. Christina Kasprzak May, 2011. Using data for improvement. Analyzing the Data Interpreting the Data Planning for Improvement. Analyzing the data – what is the evidence?. Evidence refers to the numbers, such as “89% of families reported ...â€

E N D
Using Data for Program Improvement Christina Kasprzak May, 2011
Using data for improvement Analyzing the Data Interpreting the Data Planning for Improvement
Analyzing the data – what is the evidence? • Evidence refers to the numbers, such as“89% of families reported ...” • The numbers are not debatable
Interpreting the data – what do you mean? • How do you interpret the numbers? • What can you conclude from the numbers? • Does evidence mean good news? Bad news? News we can’t interpret? • To reach an inference, sometimes we analyze data in other ways (ask for more evidence).
Planning for improvement- what actions will you take? • Given the inference from the numbers, what should be done? • What are recommended actions? • What quality practices could help accomplish this outcome? • Another role for stakeholders?
Ensuring quality of our data • Return rate • Representative of population served
Analyzing family outcomes survey data What do I do with my family outcomes data? • Looking at outcomes for all families in the program • Looking at outcomes by sub-groups • Looking at outcomes over time
Looking at family outcomes for all families • Overall means on indicator(s) • Frequency distributions
Palau: Frequency distribution • To what extent has your child’s program: • helped you know how to help your child learn? • encouraged you to be actively involved in your child’s education? • included you as a full partner in making decisions about your child’s education? Figure 3: 2009 Preschool Survey Results
Looking at family outcomes by subgroups System Characteristics Service Characteristics Family Characteristics Child Characteristics
Are there differences in outcomes… … across the system? • Do you have regions/programs that are reasonable subgroups? • What about classrooms, teams, providers? • Type of program?
Are there differences in outcomes… … across service characteristics? • Types of service • Intensity of services • Where services received • etc.
What system or service variables make the most sense when analyzing YOUR data? -Region, program, classroom, team, provider, type of program, etc.? -Type of service, intensity of service, where service is received, etc.?
Are there differences in outcomes… … across family characteristics? • Race/ethnicity • Family income • Primary language • etc.
Are there differences in outcomes… … across child characteristics? • Race/ethnicity • Family income • Primary language • etc.
CNMI-C Table 2. Percent of Families who Report that Early Intervention Services has Helped their Family in Measurement A, B, and C
What family or child characteristics make the most sense when analyzing YOUR data? -Family race/ethnicity, income, language, length of time in service, etc.? -Child race/ethnicity, type of disability, length of time in service, etc.?
OSEP indicators 4a, 4b, 4c: Statewide results (2006-2008)
AS- PART C Q16: Know their rights Indicator 4: Year-to-Year comparisons for question 16
Guam Part C- Item comparison over time June 2004 & June 2005 Parent Survey Responses Related to Family Capacity
Family survey: Statewide response to questions 1-15
If the lowest rated items are: KNOWING YOUR RIGHTS AND ADVOCATING FOR YOUR CHILD 4. How much does your family know about the programs and services that are available? 6. How familiar is your family with your rights? HAVING SUPPORT SYSTEMS 10. How often does your family have someone your family trusts to listen and talk with when they need it? 11. How often does your family have someone you can rely on for help when your family needs it? 12. How often is your family able to do the things your family enjoys? ACCESSING YOUR COMMUNITY 15. How often does your child participate community/social activities right now? Then what kinds of improvements in practices would you want to implement?
AS- Part B items (not their chart) Teachers and administration… • seek out my input; • Show sensitivity to the needs of my child; • Encourage me to participate in the decision-making process; • Respect my cultural heritage; • Help me to understand the Procedural Safeguards [the rules in federal law that protect the rights of parents]; and • Show a willingness to learn more about my child’s needs.
MH- Report by items More than 90% of the parents surveyed during FFY 2009 monitoring visits also indicated they would be able to: • locate policies and procedures related to special education and free appropriate public education; • identify RMI’s special education programs and services; • exercise rights as parents of a child with disabilities; • participate in the education of their children; and • assist and support the public education system.
Using data for improvement Analyzing the Data Interpreting the Data Planning for Improvement Then… did your improvement activities make a difference?