Download
1 / 58
580 likes | 585 Views
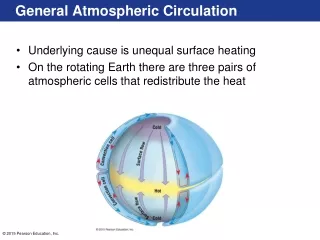
Understanding Atmospheric Circulation. By Rich Hedman Super SIRC Science Saturday 5/4/2013. Goals for Workshop. Three main goals: To develop in each of you an understanding of the science content. To encourage each of you to use a. student-centered. and student idea -centered.

E N D
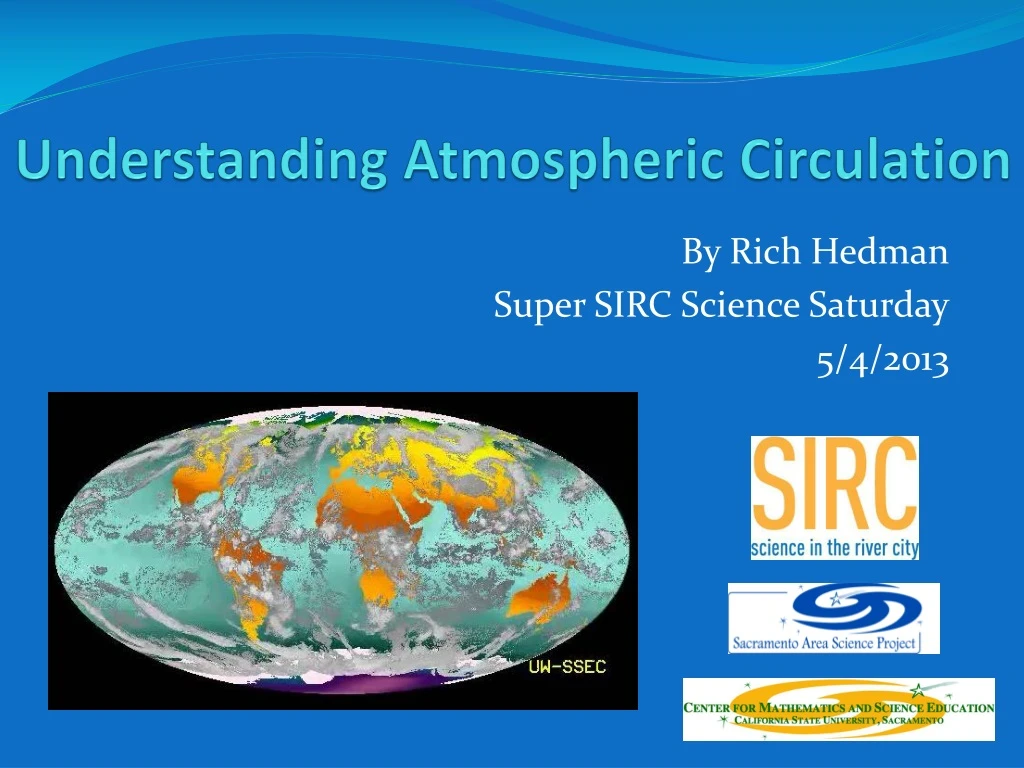
Understanding Atmospheric Circulation By Rich Hedman Super SIRC Science Saturday 5/4/2013
Goals for Workshop • Three main goals: • To develop in each of you an understanding of the science content. • To encourage each of you to use a student-centered and student idea-centered instructional approach.
Instead of the more traditional teacher-centered approach. Not too much of this in workshop today
Goals for Workshop • Three main goals: • To develop in each of you an understanding of the science content. • To encourage each of you to use a student-centered and student idea-centered instructional approach. • To encourage each of you to engage your students in the practices of science.
Asking Questions & Defining Problems Using Mathematics & Computational Thinking The Science Practices Developing & Using Models Engaging in Argument from Evidence Planning & Carrying out Investigations Constructing Explanations & Designing Solutions Obtaining, Evaluating, & Communicating Information Analyzing and Interpreting Data
Asking Questions & Defining Problems Using Mathematics & Computational Thinking The Science Practices Developing & Using Models Engaging in Argument from Evidence Planning & Carrying out Investigations Constructing Explanations & Designing Solutions Obtaining, Evaluating, & Communicating Information Analyzing and Interpreting Data
Developing & Using Models • These lessons were designed to engage the learner in developing and using models. • There are many types of models—physical representations, scale models, computer models—but to us, a model is a set of ideas about a natural process. • A scientific model can be used to explain natural phenomena, to make predictions, and to connect ideas.
These are NOT the kinds of models we are talking about: These are physical replicas, tools, or representations that may be useful in communicating about and reasoning with underlying models.
Rules of Engagement • Be considerate and respectful in language and tone. • Make sure everyone has a chance to express their ideas. • Try to not steal anyone’s “Aha!” moment by “telling” them your “answers”—instead ask questions that will guide your group to these ideas. (ask, don’t tell!)
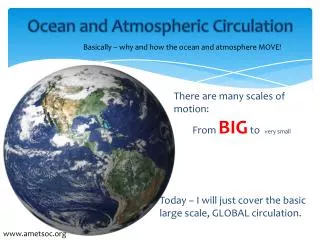
Phenomena: Cloud Motion • Models are based on natural phenomena. • The phenomena we will observe is cloud motion from satellite images. Task 1: • Study the video carefully and look for “large scale motion”. • Note that we can’t really see anything > 60 degrees latitude. • Summarize the patterns in cloud motion by drawing arrows indicating wind direction on the blank map provided to you.
Phenomena: Global Cloud Motion What patterns do you notice?
Consensus on Phenomena ? Instructor-led questions—seek input from each group—and sketch patterns on the board: • First of all, did you notice any patterns? • Ok, what were they? Let’s start at the equator. • How about north of the equator? • How about south of the equator? • Discuss the data patterns noticed by each person and come to a consensus regarding the general wind direction in each band of latitude shown on the map. • If there are conflicting ideas about the data patterns, draw multiple versions. • Keep these posted somewhere for future reference.
Driving Question • What causes the patterns in earth’s atmospheric circulation? • We will answer the question by developing explanatory models, from basic to complex.
Side Note: Important Prior Knowledge • The models we will develop are based on two important underlying models. • If you have not worked with students to develop these underlying ideas, now would be an appropriate time. • We are not going to do these activities with you, but we are going to show you how we do it. • We begin by asking a driving question: How does air “behave”? • And students observe several simple stations to collect information…
Side Note: How does air “behave”? For each activity, take observations on the sheet provided. • Activity 1: Phenomena: CO2 in trash can, several inflated balloons. • Balloons float on layer of CO2 • Activity 2: Phenomena: Pour CO2 into container with lit candle. • CO2 pours like water. • Activity 3: Phenomena: Dry ice + water in beaker • Cold water “vapor” sinks and flows. • Activity 4: Phenomena: Boiling water in beaker on hotplate • Hot water “vapor” rises. • Activity 5: Phenomena: Lit candles below fan blade & angels • Hot air must be rising to move the fan.
Side Note: Conclusions about Air & Gases Based on your observation and the data patterns, what are some things you can conclude about air and gases? • Gases can form layers. • Gases can pour like water. • Cold gases can sink and flow across tables. • Hot gases can rise and make fan blades spin. • IN GENERAL: • air & gases behave similarly to water & liquids. • That is why we call both gases and liquids FLUIDS. • But why do fluids rise, sink, and flow?
Side Note: Currents in Fluids • The 2nd underlying model students need to understand is related to convection currents, or more generally, what we prefer to call density currents. We recommend doing these as labs, but in the interest of time today we will watch 3 video clips of the phenomena. • Watch video clips—search for the data patterns. • Conclusions—what are some things you can conclude about currents in fluids?
Side Note:Summary of Important Prior Knowledge • Air is a fluid. • In fluids: These density currents are also called convection currents. The atmosphere is composed of air. Moving air is called wind. Wind is a current of air.
Driving Question (Revisit) • What causes the patterns in earth’s atmospheric circulation? • We will answer the question by developing explanatory models, from basic to complex.
Consider the Earth • Where is it usually warm on earth? • Where is it usually cold on earth?
How do we know? DATA! • Where is it usually warm on earth? • Where is it usually cold on earth?
Make a Prediction Make a prediction: • Where would air be rising from earth’s surface? • Where would air be sinking toward earth’s surface?
Basic Model Based on your understanding of 1) air as a fluid, 2) convection currents, and 3) the earth temperature map, predict the convection cells these ideas imply in our atmosphere. TASK 2: Use the materials provided to make a 3-D representation of your convection cells around your globe.
Handout for Task 2: Basic Model Materials: beach ball globes (prepared w/ up & down arrows), transparency strips, tape, transparency pens (red, blue, black), paper towel & water (for erasing), poster paper, poster markers (red, blue, black). Task 2: With your group: 1. Use a black transparency pen to draw the surface winds on your globe predicted by your model. 2. Now use the transparency strips to make a 3-D representation of the convection cells around the globe implied by your model. • Draw arrows on the transparency strips to indicate the direction of air. • Use red for warm air and blue for cold air.
Task 2: Representation of Basic Model In the end, students’ globes will look something like:
Task 2: Representation of Basic Model In the end, students’ drawings should look something like: • It is important to have students continually shift from 3-D representations to 2-D flat drawings. • Most people have difficulty thinking and visualizing in 3-D and practice helps.
Task 2: Representation of Basic Model In the end, students’ drawings should look something like: • Basic Model: • Earth’s air is heated differentially by the sun (warm equator, cold poles). • Temp differences produce density differences in air. • Gravity differentially effects air masses with different densities. • Warm air rises at equator; cold air sinks at poles. • The result is one large convection cell the N. and S. hemispheres.
Compare Basic Model to Phenomena Our Basic Model Actual Phenomena Our basic model has a problem! We need more data.
Data: Earth is Big! Because earth is so big, warm air rising at the equator cools well before it reaches the poles. This air at altitude doesn’t reach the north pole, it cools and sinks long before it reaches the pole.
Earth is Big! (Cont.) Also, because earth is so big, cold air sinking at the poles warms well before it travels back to the equator. This surface air doesn’t reach the equator, it warms up and rises well before it reaches the equator.
Task 3: Revise the Basic Model Task 3: With your group, 1. Discuss how to best revise your model to take into account that earth is large. 2. Then use the transparency strips to make a 3-D representation of the convection cells around the globe implied by your model. Draw arrows on the transparency strips to indicate the direction of air. Use red for warm air and blue for cold air. 3. Be prepared to share and explain your model.
Task 3: Revise the Basic Model (Cont.) 4. On poster paper, sketch a circle for earth, and draw in your convection cells and your predicted surface air currents. Use red for warm air and blue for cold air.
Task 3: Share & Explain Group Models • Groups share and explain their revised basic models. • After discussion, develop a class consensus model that fits the data we have so far.
Class Consensus Model The class consensus model should look something like:
Class Consensus Model What we have added to our earlier model: • Because the earth is so large, density differences produce multiple (an odd number) convection cells in the N. hemisphere and multiple (an odd number) convections cells in the S. hemisphere.
Compare Class Model to Phenomena Our Class Model Actual Phenomena Our model still has a problem! We need YET MORE DATA
Data: Earth is Spinning! • Earth’s spin is counter-clock wise (CCW) when viewed from the North Pole. • Earth’s spin is clockwise (CW) when viewed from the South Pole. CCW CW
Data: Earth is Spinning! • While watching MIT video, pay attention to the data patterns. • If spinning clockwise, the ball is deflected? • If spinning counter-clockwise, the ball is deflected?
Spinning Data Pattern • Summarize the data patterns you noticed on the board: • If spinning clockwise, the thrown ball is always deflected ___________________? • If spinning counter clockwise, the thrown ball is always deflected ___________________?
Task 4: Final Model How would this affect the wind directions on your model? Draw in the deflections you predict will occur on your poster.
Task 4: Final Model Have a group or two share their final model. Now let’s look at the scientific consensus of the wind patterns…
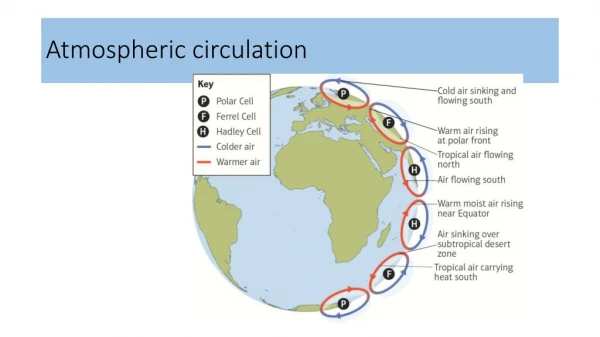
Representation of Final Model • What we added to our model: • Earth’s spin deflects poleward wind west and equatorward wind east.
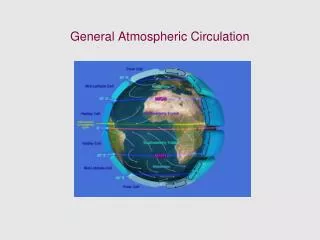
Representation of Final Model of Surface Winds N. Hemisphere winds deflected to the right of original path. S. Hemisphere winds deflected to the left of original path. Final Model
Representation of Final Model of Surface Winds Alternatively: In both hemispheres, poleward wind is deflected to the EAST, and equatorward wind is deflected to the WEST. Final Model
Compare Final Model to Phenomena Final Model Actual Phenomena Our final model predicts the actual wind patterns!
Simple Version of Final Model Our simple model which explains earth’s atmospheric circulation: Uneven heating of earth + earth’s large size + earth’s spin rate => observed global wind patterns. We can describe the causal relationships within this model in much more detail . . . (next slide)