Download
1 / 10
100 likes | 233 Views
Persistence of Regional Differences in West Nile Neuroinvasive Disease (WNND) Risk Across Texas. age-standardized Regional incidence and regional RR; 2003 – 2005; western Texas vs. remainder of state. Ronald Warner, DVM, PhD*; Defeng Luo, MD*; James Schuermann, BS # ;

E N D
Persistence of Regional Differences in West Nile Neuroinvasive Disease (WNND) Risk Across Texas.age-standardized Regional incidence and regional RR;2003 – 2005; western Texas vs. remainder of state Ronald Warner, DVM, PhD*; Defeng Luo, MD*; James Schuermann, BS#; R. Michael Ragain, MD, MSEd*; and Peter Reed, MD^ * TTUHSC School of Medicine – Lubbock;# TDSHS – Austin; and ^ Graham Medical Associates – Graham, TX
PHR 1 (41 counties)crude incidence: 13.36 / 100Kcrude RR = 8.1 Age-specific incidence rates: < 5 y/o: 0 / 58,109 5 - 17 y/o: 3.17 / 100K 18 - 64 y/o: 12.53 / 100K> 65 y/o: 41.23 / 100K Age-adjusted incidence:12.48 / 100K &RR = 7.47 ; 95% CI: 5.99 - 9.31 154 other TX counties1.65 / 100K ( 20,180,344 ) Age-specific incidence rates: < 5 y/o: 0.25 / 100K 5 - 17 y/o: 0.34 / 100K18 - 64 y/o: 1.60 / 100K> 65 y/o: 6.01 / 100K Age-adjusted incidence:1.67 / 100K 2003 human WNv ME incidence in PHR 1 &154 other TX counties that reported any WNv activity
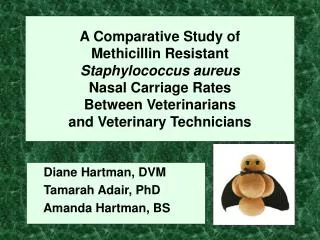
HSR 1 (41 counties)crude incidence: 13.3 / 100Kage-adj. Std incidence: 12.8 (9.4 - 17.4) Std RR = 8.0 (6.4 - 9.9) HSRs 9 / 10 (36 counties)crude incidence: 4.0 / 100Kage-adj. Std incidence: 4.1 (2.8 - 5.9) Std RR = 2.1 (1.6 - 2.9) HSRs 2 / 3 (49 counties)crude incidence: 1.7 / 100Kage-adj. Std incidence: 1.8 (1.3 - 2.5) Std RR = 0.9 (0.7 - 1.1) HSRs 4,5,6 (49 counties)crude incidence: 1.5 / 100Kage-adj. Std incidence: 1.5 (1.1 - 2.1) Std RR = 0.7 (0.5 - 0.9) HSRs 7,8,11 (79 counties)crude incidence: 1.0 / 100Kage-adj. Std incidence: 1.0 Std RR = 0.4 (0.3 - 0.5) State-wide:crude incidence: 2.0 / 100K Age-specific incidence < 5 y/o: 0.12 / 100K 5-19 y/o: 0.4220-64 y/o: 1.88> 65 y/o: 7.22 Males: 2.39 / 100KFemales 1.56 / 100Kage adj. RR = 1.7 (1.4 - 2.0) highlights * - 2003 human WNND incidence & RR in TXage-adjusted, by HS Regions * Warner, Kimbrough, Alexander, Pierece, Ward & Martinelli. 2006.Ann Epidemiol 16:749-755
Wk 33 in ‘03; 10-16 Aug (wk 34 was 17-23 Aug)
Wk 34 in ’04; 22-28 Aug Wk 34 in ‘05; 21-27 Aug
Demographic distribution of WNND cases:reports from 2003, 2004, 2005; Texas • by age group: 200320042005 < 5 : 2, 0, 1 5 -19 : 24, 4, 2 20-64 : 253, 67, 69> 65 : 158, 48, 55 • by HSRs: 1 : 105, 18, 16 2 / 3 : 112, 18, 344, 5, 6 : 103, 43, 577, 8, 11 : 67, 8, 10 9 / 10 : 50, 32, 10
Human Population estimates: 2004U.S. Census Bureau • HSR 1 ( 41 counties ) = 791,835 • HSRs 2 / 3 ( 49 counties) = 6,587,715 • HSRs 4, 5, & 6 ( 49 counties) = 7,031,411 • HSRs 7, 8, & 11 ( 79 counties) = 6,811,094 • HSRs 9 / 10 ( 36 counties) = 1,267,967 Texas = 22,490,022
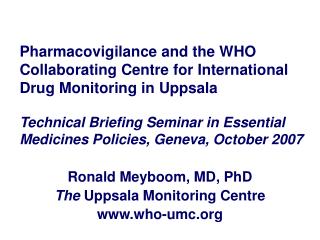
HSR 1 (41 counties)crude incidence: 4.3 / 100Kage-adj. Std incidence: 15.4 (8.7 - 27.3) crude RR = 4.4 HSRs 9 / 10 (36 counties)crude incidence: 3.3 / 100Kage-adj. Std incidence: 12.3 (7.1 - 21.49) crude RR = 3.4 HSRs 4,5,6 (49 counties)crude incidence: 1.4 / 100Kage-adj. Std incidence: 5.5 (3.3 - 9.1) crude RR = 1.5 HSRs 2 / 3 (49 counties)crude incidence: 0.8 / 100Kage-adj. Std incidence: 3.1 (1.8 – 5.3) crude RR = 0.65 HSRs 7,8,11 (79 counties)crude incidence: 0.3 / 100Kage-adj. Std incidence: 1.0 crude RR = 0.18 State-wide (two yrs; not annual)crude incidence: 1.1 / 100K Age-specific incidence < 5 y/o: 0.06/ 100K 5-19 y/o: 0.1220-64 y/o: 1.00> 65 y/o: 4.63 Males: 1.43 / 100KFemales 0.74 / 100Kage adj. RR = 2.2 (1.7 - 2.8) Highlights - ‘04 + ‘05 (2 yr) human WNND incidence & RR in TXage-adjusted, by HSR region
What accounts for West Texas’ excess WNND risk ? • Obviously, vector-borne disease “cause” is multi-factorial • Culex tarsalis – the “Western encephalitis mosquito”(“1000+” in one trap-night near playa in Lubbock Co.) predominates in HSRs 1 & 9/10 [82.9 - 79.6% of pools]; Cx. quinquefasciatus predominates in HSRs 4,5,6,7,8,11 [98.4 - 93.9% of pools];While HSRs 2/3 are a “transition zone” (77.8% Cx. quinquefasciatus) • Playa depressions / lakes: “800+” just in Lubbock Co.(thought to be 20,000+ on the Southern High Plains) • Rain … at the “right” time for max. mosquito densities • Intensive irrigated croplands & associated outdoor agricultural activities • Densities of amplifying birds (reservoir species) ?