Download
1 / 1
10 likes | 146 Views
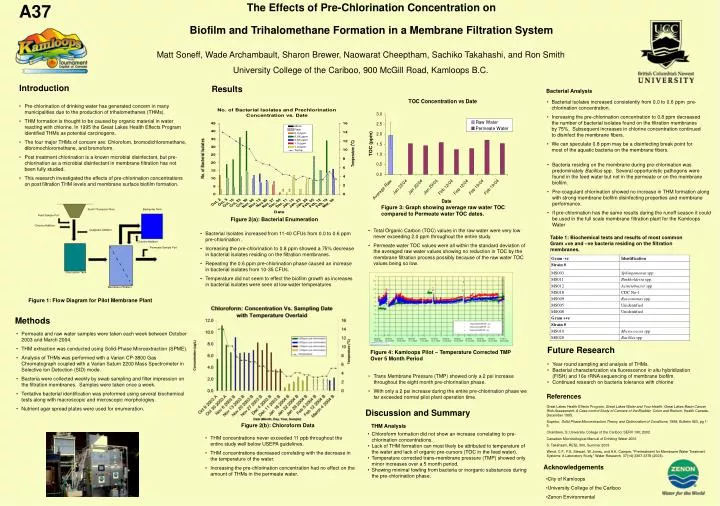
A37. The Effects of Pre-Chlorination Concentration on Biofilm and Trihalomethane Formation in a Membrane Filtration System. South Thompson River. Backpulse Tank. Feed Sample Port. Chlorine Addition. Coagulant Addition. Chlorine Addition. Permeate Sample Port. Flocculation Tank.

E N D
A37 The Effects of Pre-Chlorination Concentration on Biofilm and Trihalomethane Formation in a Membrane Filtration System South Thompson River Backpulse Tank Feed Sample Port Chlorine Addition Coagulant Addition Chlorine Addition Permeate Sample Port Flocculation Tank Membrane Filtration Figure 4: Kamloops Pilot – Temperature Corrected TMP Over 5 Month Period Figure 2(b): Chloroform Data Figure 1: Flow Diagram for Pilot Membrane Plant Figure 2(a): Bacterial Enumeration References Acknowledgements • Great Lakes Health Effects Program, Great Lakes Water and Your Health: Great Lakes Basin Cancer Risk Assessment: A Case-control Study of Cancers of the Bladder, Colon and Rectum, Health Canada, December 1995. • Supelco, Solid Phase Microextraction Theory and Optimization of Conditions; 1998; Bulletin 923, pg 1-5. • Chambers, S; University College of the Cariboo: SERV 190; 2002 • Canadian Microbiological Manual of Drinking Water 2003 S. Takahashi, RESL 300, Summer 2003 Wend, C.F., P.S. Stewart, W. Jones, and A.K. Camper, "Pretreatment for Membrane Water Treatment Systems: A Laboratory Study," Water Research, 37(14):3367-3378 (2003). • City of Kamloops • University College of the Cariboo • Zenon Environmental Matt Soneff, Wade Archambault, Sharon Brewer, Naowarat Cheeptham, Sachiko Takahashi, and Ron Smith University College of the Cariboo, 900 McGill Road, Kamloops B.C. Introduction Results Bacterial Analysis • Bacterial isolates increased consistently from 0.0 to 0.6 ppm pre-chlorination concentration. • Increasing the pre-chlorination concentration to 0.8 ppm decreased the number of bacterial isolates found on the filtration membranes by 75%. Subsequent increases in chlorine concentration continued to disinfect the membrane fibers. • We can speculate 0.8 ppm may be a disinfecting break point for most of the aquatic bacteria on the membrane fibers. • Pre-chlorination of drinking water has generated concern in many municipalities due to the production of trihalomethanes (THMs). • THM formation is thought to be caused by organic material in water reacting with chlorine. In 1995 the Great Lakes Health Effects Programidentified THMs as potential carcinogens. • The four major THMs of concern are: Chlorofom, bromodichloromethane, dibromochloromethane, and bromoform. • Post treatment chlorination is a known microbial disinfectant, but pre-chlorination as a microbial disinfectant in membrane filtration has not been fully studied. • This research investigated the effects of pre-chlorination concentrations on post filtration THM levels and membrane surface biofilm formation. • Bacteria residing on the membrane during pre-chlorination was predominately Bacillus spp. Several opportunistic pathogens were found in the feed water but not in the permeate or on the membrane biofilm. • Pre-coagulant chlorination showed no increase in THM formation along with strong membrane biofilm disinfecting properties and membrane performance. • If pre-chlorination has the same results during the runoff season it could be used in the full scale membrane filtration plant for the Kamloops Water Figure 3: Graph showing average raw water TOC compared to Permeate water TOC dates. • Total Organic Carbon (TOC) values in the raw water were very low never exceeding 2.0 ppm throughout the entire study. • Permeate water TOC values were all within the standard deviation of the averaged raw water values showing no reduction in TOC by the membrane filtration process possibly because of the raw water TOC values being so low. • Bacterial Isolates increased from 11-40 CFUs from 0.0 to 0.6 ppm pre-chlorination . • Increasing the pre-chlorination to 0.8 ppm showed a 75% decrease in bacterial isolates residing on the filtration membranes. • Repeating the 0.6 ppm pre-chlorination phase caused an increase in bacterial isolates from 10-35 CFUs. • Temperature did not seem to effect the biofilm growth as increases in bacterial isolates were seen at low water temperatures Table 1: Biochemical tests and results of most common Gram +ve and –ve bacteria residing on the filtration membranes. Methods • Permeate and raw water samples were taken each week between October 2003 and March 2004. • THM extraction was conducted using Solid-Phase Microextraction (SPME). • Analysis of THMs was performed with a Varian CP-3800 Gas Chromatograph coupled with a Varian Saturn 2200 Mass Spectrometer in Selective Ion Detection (SID) mode. • Bacteria were collected weekly by swab sampling and filter impression on the filtration membranes. Samples were taken once a week. • Tentative bacterial identification was preformed using several biochemical tests along with macroscopic and microscopic morphologies. • Nutrient agar spread plates were used for enumeration. • Future Research • Year round sampling and analysis of THMs. • Bacterial characterization via fluorescence in situ hybridization (FISH) and 16s rRNA sequencing of membrane biofilm. • Continued research on bacteria tolerance with chlorine • Trans Membrane Pressure (TMP) showed only a 2 psi increase throughout the eight month pre-chlorination phase. • With only a 2 psi increase during the entire pre-chlorination phase we far exceeded normal pilot plant operation time. Discussion and Summary THM Analysis • Chloroform formation did not show an increase correlating to pre- chlorination concentrations. • Lack of THM formation can most likely be attributed to temperature of the water and lack of organic pre-cursors (TOC in the feed water). • Temperature corrected trans-membrane pressure (TMP) showed only minor increases over a 5 month period. • Showing minimal fowling from bacteria or inorganic substances during the pre-chlorination phase. • THM concentrations never exceeded 11 ppb throughout the entire study well below USEPA guidelines. • THM concentrations decreased correlating with the decrease in the temperature of the water. • Increasing the pre-chlorination concentration had no effect on the amount of THMs in the permeate water.