Download
1 / 1
10 likes | 141 Views
178 m. 800 m. α ). α ). Slope = tan -1 (Relief / Radius) = tan -1 (178 m / 800 m) = tan -1 (0.2225) = 12.5°. Abstract

E N D
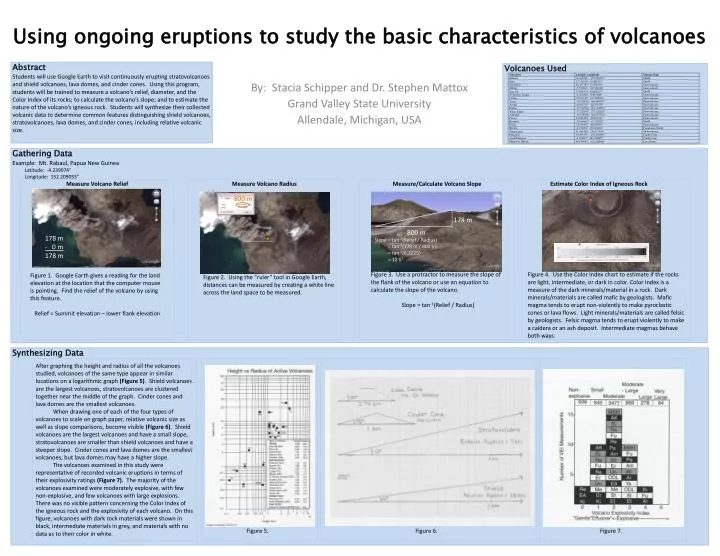
178 m 800 m α) α) Slope = tan-1(Relief / Radius) = tan-1(178 m / 800 m) = tan-1(0.2225) = 12.5° Abstract Students will use Google Earth to visit continuously erupting stratovolcanoes and shield volcanoes, lava domes, and cinder cones. Using this program, students will be trained to measure a volcano’s relief, diameter, and the Color Index of its rocks; to calculate the volcano’s slope; and to estimate the nature of the volcano’s igneous rock. Students will synthesize their collected volcanic data to determine common features distinguishing shield volcanoes, stratovolcanoes, lava domes, and cinder cones, including relative volcanic size. Volcanoes Used Gathering Data Example: Mt. Rabaul, Papua New Guinea Latitude: -4.239074° Longitude: 152.209033° Measure Volcano Relief Measure Volcano Radius Measure/Calculate Volcano Slope Estimate Color Index of Igneous Rock Synthesizing Data 800 m Using ongoing eruptions to study the basic characteristics of volcanoes 178 m - 0 m 178 m Figure 1. Google Earth gives a reading for the land elevation at the location that the computer mouse is pointing. Find the relief of the volcano by using this feature. Relief = Summit elevation – lower flank elevation Figure 3. Use a protractor to measure the slope of the flank of the volcano or use an equation to calculate the slope of the volcano. Slope = tan-1(Relief / Radius) Figure 4. Use the Color Index chart to estimate if the rocks are light, intermediate, or dark in color. Color Index is a measure of the dark minerals/material in a rock. Dark minerals/materials are called mafic by geologists. Mafic magma tends to erupt non-violently to make pyroclastic cones or lava flows. Light minerals/materials are called felsic by geologists. Felsic magma tends to erupt violently to make a caldera or an ash deposit. Intermediate magmas behave both ways. Figure 2. Using the “ruler” tool in Google Earth, distances can be measured by creating a white line across the land space to be measured. By: Stacia Schipper and Dr. Stephen Mattox Grand Valley State University Allendale, Michigan, USA After graphing the height and radius of all the volcanoes studied, volcanoes of the same type appear in similar locations on a logarithmic graph (Figure 5). Shield volcanoes are the largest volcanoes, stratovolcanoes are clustered together near the middle of the graph. Cinder cones and lava domes are the smallest volcanoes. When drawing one of each of the four types of volcanoes to scale on graph paper, relative volcanic size as well as slope comparisons, become visible (Figure 6). Shield volcanoes are the largest volcanoes and have a small slope, stratovolcanoes are smaller than shield volcanoes and have a steeper slope. Cinder cones and lava domes are the smallest volcanoes, but lava domes may have a higher slope. The volcanoes examined in this study were representative of recorded volcanic eruptions in terms of their explosivity ratings (Figure 7). The majority of the volcanoes examined were moderately explosive, with few non-explosive, and few volcanoes with large explosions. There was no visible pattern concerning the Color Index of the igneous rock and the explosivity of each volcano. On this figure, volcanoes with dark rock materials were shown in black, intermediate materials in grey, and materials with no data as to their color in white. Figure 7. Figure 5. Figure 6.