Download
1 / 21
210 likes | 401 Views
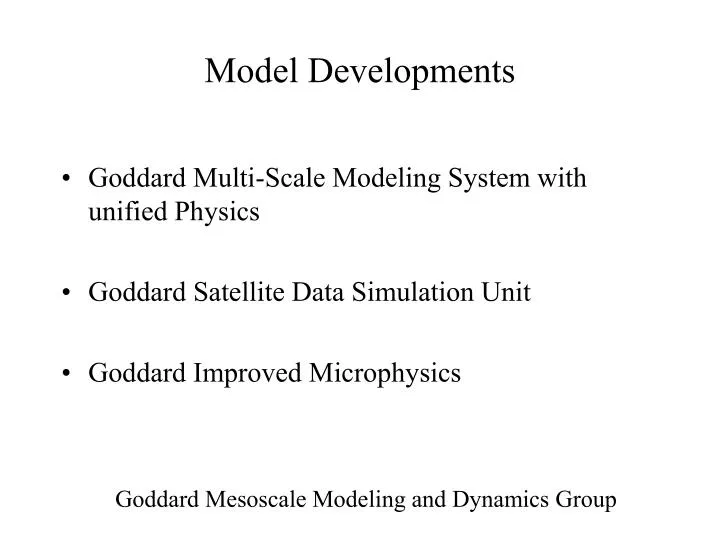
Model Developments. Goddard Multi-Scale Modeling System with unified Physics Goddard Satellite Data Simulation Unit Goddard Improved Microphysics. Goddard Mesoscale Modeling and Dynamics Group. Goddard Multi-scale Modeling System with Unified Physics.

E N D
Model Developments • Goddard Multi-Scale Modeling System with unified Physics • Goddard Satellite Data Simulation Unit • Goddard Improved Microphysics Goddard Mesoscale Modeling and Dynamics Group
Goddard Multi-scale Modeling System with Unified Physics Recently, a multi-scale modeling system with unified physics was developed at NASA Goddard. It consists of (1) the Goddard Cumulus Ensemble model (GCE), a cloud-resolving model (CRM), (2) the NASA unified Weather Research and Forecasting Model (WRF), a region-scale model, and (3) the coupled fvGCM-GCE, the GCE coupled to a general circulation model (or GCM known as the Goddard Multi-scale Modeling Framework or MMF). The same cloud microphysical processes, long- and short-wave radiative transfer and land-surface processes are applied in all of the models to study explicit cloud-radiation and cloud-surface interactive processes in this multi-scale modeling system. This modeling system has been coupled with a multi-satellite simulator for comparison and validation with NASA high-resolution satellite data. The left figure shows the multi-scale modeling system with unified physics. The GCE and WRF share the same microphysical and radiative transfer processes (including the cloud-interaction) and land information system (LIS). The same GCE physics will also be utilized in the Goddard MMF. The idea to have a multi-scale modeling system with unified physics is to be able to propagate improvements made to a physical process in one component into other the components smoothly and efficiently. Left-upper panel shows the GCE high-resolution (250m) simulated a South American MCS. Left-lower panel shows the WRF (1.67 km) Hurricane Katrina (2005) simulation. Right-upper panel shows the MMF simulated and TRMM observed rainfall. Tao, W.-K., D. Anderson, J. Chern, J. Estin, A. Hou, P. Houser, R. Kakar, S. Lang, W. Lau, C. Peters-Lidard, X. Li, T. Matsui, M. Rienecker, M. R. Schoeberl B.-W. Shen, J.-J. Shi, and X. Zeng, 2009: Goddard Multi-Scale Modeling Systems with Unified Physics,Annales Geophysics, 27, 3055-3064.
Goddard Satellite Data Simulation Unit (SDSU)for evaluating models’ performance and supporting NASA’s satellite missions Examine an evaluation method for Goddard multi-scale modeling system by using direct measurements from space-born, airborne, and ground-based remote sensing. Support the NASA’s satellite mission (e.g., A-Train, GPM and ACE) through providing the virtual satellite measurements as well as simulated geophysical parameters to satellite algorithm developers. Masunaga, H., Matsui, T., W.-K. Tao, A. Y. Hou, C. Kummerow, T. Nakajima, P. Bauer, W. Olson, M. Sekiguchi, and T. Y. Nakajima, 2009: Satellite Data Simulation Unit: Multi-Sensor and Multi–Frequency Satellite Simulator package, Bulletin of American Meteorological Society, (submitted).
IMPROVE BIN MICROPHYSICAL SCHEME USING TRMM DATA C-band surface radar TRMM PR TRMM TMI 85GHz OBSERVED SIMULATED IMPROVED SIMULATION Squall lines in central US Li, X., W.-K. Tao, T. Matsui, C. Liu and H. Masunaga, 2009: Improving spectral bin microphysical scheme using TRMM satellite observations. Quart. J. Roy. Meteor. Soc. (accepted).
An important aspect of aerosol-cloud-precipitation interaction is the origin of the aerosols serving as cloud condensation nuclei (CCN) - Using tracer transportation as an indicator The stronger, organized systems like the PRESTORM squall case are able to transport a significant amount of near surface pollutants into the upper troposphere (over 65%). The majority of aerosols come from lower levels, entering into clouds via cloud base. A significant amount of aerosols at mid-levels can be entrained via cloud sides (e.g., the CRYSTAL case). The amount of mid-level entrainment varies with storm type (i.e., updraft intensity and storm longevity). Figure shows the redistribution of low and midlevel tracers for two cases, a mid-latitude continental squall system observed during PRESTORM(Preliminary Regional Experiment for STORM-Central) and mid-afternoon convection observed during CRYSTAL-FACE(Cirrus Regional Study of Tropical Anvils and Cirrus Layers – Florida Area Cumulus Experiment)
Improved Performance of the GCE Bulk Microphysics Climatologically, penetrations of 40-dBZ radar echoes above 10 km are rare even over land (Zipser et al. 2006; Liu et al. 2008) Through a series of improvements to the ice processes in the GCE model’s bulk microphysics scheme, the bias in the penetration of excessively high reflectivity values to upper levels due to overly large amounts of precipitation ice particles was significantly reduced Time-height cross sections of maximum radar reflectivity obtained from 3D simulations of the 23 February 1999 easterly regime event observed during TRMM LBA (Large Scale Biosphere-Atmosphere Experiment in Amazonia) using the original Rutledge and Hobbs (1984) based bulk microphysics formulation (top panel) and an improved version (bottom panel). Ground-based radar data for this case indicated 40-dBZ echoes reached to approximately 8 km.
Using improved Goddard Microphysics to simulate a 50-year flooding event over Taiwan: The 2400 mm rainfall from Typhoon Morakot Typhoon Morakot struck Taiwan on the night of Friday August 7th, 2009 as a category 2 storm with sustained winds of 85 knots (92 mph). Although the center made landfall in Hualien county along the central east coast of Taiwan and passed over the central northern part of the island, it was southern Taiwan that received the worst effects of the storm where locally as much as 2000 mm (2 m) of rain were reported, resulting in the worst flooding there in 50 years. The result of the enormous amount of rain has been massive flooding and devastating mudslides. More than 600 people are confirmed dead. High-resolution (2-km) WRF with improved Goddard microphysics will be used for simulate this typhoon case. The improved microphysical scheme captured both in terms of maximum rainfall area and intensity (left figures and table). The model also found that the heavy amounts of rain over the southern portion of the island is due to persistent southwesterly flow associated with Morakot and it's circulation was able to draw up copious amounts of moisture from the South China Sea into southern Taiwan where it was able to interact with the steep topography. Observed and WRF simulated accumulated surface rainfall (mm). The top two panels are the observed 48- (left) and 72-h (right) observed rainfall (based on dense rain gauge network). The bottom two panels are with 2 km grid spacing with improved microphysics at corresponding 48- (left) and 72- h (right) WRF simulations. The maximum rainfall simulated by model with different Goddard microphysical options. Observed maximum rainfall is also shown for comparison.
U.S. Diurnal Rainfall Climatology Map (JJA 1998~2008) Masked out dry region (<0.1mm/hr) Appalachian Mts MCS Phase speed ≈24.0m/s Hovmöller diagrams NAMS Continental Divide MCS Phase speed ≈17.7m/s Objectives • Understand climatology of US warm-season rainfall diurnal cycle using NLDAS rainfall data. • Examine eastward propagating mesoscale convective system (MCSs). Results • MCSs dominate diurnal cycle of rainfall across the Great Plain, while local afternoon parcel lift typically dominate rainfall diurnal cycle in the other regions. • Propagation speed of MCSs in Maryland is about 6m/s faster than those in Great Plain. Matsui, T., M.-I. Lee, J. Chern, D. Mocko, and W.-K. Tao (2009), 10-year Climatology of the Diurnal Cycle in Summertime Rainfall Over the Conterminous U.S. (to be submitted to GRL)
Sensitivity of Clouds and Radiation to Ice Nuclei (IN) Objectives Ice nuclei (IN, a class of atmospheric aerosols) change clouds that in turn change radiation and climate. The Goddard Cumulus Ensemble (GCE) model and NASA field campaign observations are used to identify the effects of IN on clouds and radiation. Results • It is found that the ice water content in the upper troposphere increases with increasing IN concentration (right top). • It is also found that the radiative forcing changes significantly with IN in middle latitude but not in the Tropics (right bottom). Applications IN come from land instead of oceans. Industrial activities and desertification can increase IN concentration that in turn change clouds, radiation and eventually climate. This research reveals that the IN increase could have significant regional impact on climate variation, especially in middle and higher latitudes. • Zeng, X., W.-K. Tao, M. Zhang, A. Y. Hou, S. Xie, S. Lang, X. Li, D. Starr, X. Li, and J. Simpson, 2009: An indirect effect of ice nuclei on atmospheric radiation. J. Atmos. Sci., 66, 41-61. • Zeng, X., W.-K. Tao, M. Zhang, A. Y. Hou, S. Xie, S. Lang, X. Li, D. Starr, and X. Li, 2009: A contribution by ice nuclei to global warming. Quart. J. Roy. Meteor. Soc.,135, 1614-1629. Upper tropospheric ice content and TOA radiative flux versus IN concentration over various geographic regions.Modeled cloud ice content above 7.4 km (top) and net downward radiative flux at the TOA (bottom) vary with IN concentration. One line corresponds to one field campaign. Red and blue lines display the mid-latitudinal results in spring and summer, respectively; green and black lines display sub-tropical and tropical results, respectively. Red labels correspond to red lines.
Ice Nuclei and Global Warming Motive The increase in anthropogenic CO2 explains about half of the observed warming over the past 150 years and cannot satisfactorily explain the geographic variation in the warming. Of all the key uncertainties on climate forcing, the indirect effect of aerosols on clouds and radiation ranks at the top (IPCC 2007). Ice nuclei (IN), a class of aerosols, can significantly affect clouds and radiation. Their effect has not yet been put onto the famous IPCC radiative forcing bar chart. Here, it is quantified using TRMM (Tropical Rainfall Measuring Mission) data, field observations and Goddard cloud-resolving model simulations. Results • Surface warming from doubling the IN concentrations is compared with that from anthropogenic CO2 (right). It is found that the former effect is stronger than the latter in middle and high latitudes but not in the Tropics. • The effect of doubling IN on warming is stronger at higher latitude, and stronger in spring than in summer. Summary The global desertification and industrialization over the past decades have led to an increase in IN concentrations that in turn have contributed to around half of the observed global warming, especially in middle and high latitudes. Hence, it is suggested that policy makers take into account IN (e.g., IN sources due to global desertification and industrialization) in determining safe levels of greenhouse gases in the atmosphere after more quantitative research on IN observations and modeling is done. Increase in radiative forcing from doubling the current IN concentration versus latitude. All of the results are obtained from the CRM simulations over the ten field campaigns. Thick and thin solid lines are introduced to fit the results to spring and summer, respectively, based on the TRMM observations. The dashed line represents the increase in radiative forcing from anthropogenic CO2. The vertical axis also scales to the increase in surface temperature. Zeng, X., W.-K. Tao, M. Zhang, A. Y. Hou, S. Xie, S. Lang, X. Li, D. Starr, and X. Li, 2009: A contribution by ice nuclei to global warming. Quart. J. Roy. Meteor. Soc.,135, 1614-1629.
Utilize high resoltuion GCM and MMF for impact weather event (MJO) The Goddard MMF based on the coupling of fvGCM and 2D GCE models has been successfully applied to long term climate studies (such as AMIP type simulations, climate change simulations), interannual variability (such as El Nino and La Nina simulations), interseasonal and seasonal variability (such as Madden-Julian Oscillation, Africa Easterly waves, draught and flood, tropical cyclones), and short-term weather events and diurnal cycle studies. To fully understand the strengths and weakness of the MMF approach in climate modeling, the simulation results have been compared rigorously against the results from fvGCM AMIP run, NCEP and ECMWF analysis, and NASA high resolution satellite observations such as the Tropical Rainfall Measuring Mission (TRMM), the Moderate Resolution Imaging Spectroradiometer (MODIS), Microwave Limb Sounder (MLS), and the CloudSat. Velocity potential at 200 hPa every 5 days in May 2002 from NCEP analysis (left panels), 15-day fvGCM model predictions at 1/8 degree resolution (middle panels), and 15-day fvMMF model predictions (right panel). The velocity potential plots showed the observed and predicted patterns and propagations of Madden-Julian Oscillation (MJO). The high-resolution fvGCM is able to reproduce realistically the observed patters and intensity as NCEP analysis. The fvMMF even with coarse-resolution (2o x 2.5o) is also able to predict the large-scale MJO event, except its intensity is somewhat overestimated
Coupled the MMF and Satellite Simulator as a New Approach for Using NASA Satellite Data The MMF can explicitly simulate cloud processes and cloud properties at the natural space and time scales of cloud systems. When the MMF coupled with the Goddard Satellite Data Simulation Unit(SDSU), the radiances and radar reflectivities/attenuation, can be directly extracted from the cloud-resolving model (CRM) -based physics embedded within the MMF and compared against NASA high-resolution satellite measurements. This approach could be a new pathway for using NASA satellite data to improve our knowledge of the cloud physical processes and leads to new improvements in cloud microphysical schemes. The MMF requires a substantial amount of computing time (about 200-500 times of the traditional GCMs). Future works of MMF development will include long-term climate simulations with much higher resolutions in both the GCM and the CRM as well as more detailed microphysical schemes and coupling with land/ocean processes. The unprece-dented spatial resolution, complexities in model physics and coupling with land/ocean models will continually push the envelope of the requirement of computing resources. It is expected to require at least 10 million CPU hours on thousands of processors and 100 TB of disk space for our future research. Contoured Frequency Altitude Diagrams (CFADs) of PR reflectivity (top panels) from MMF simulations (left) and TRMM (right) in the summer 2007 provide a useful statistical description that illustrates the effects of precipitation microphysics at different altitudes. The predicted and observed PR reflectivity at different latitude bands (lower panels) reveals that fvMMF over-predicted the PR reflectivity and did not produced the observed land-ocean contrast. These results provide better direction to improve the model cloud physics
WRF-SBM: the East Coast Winter Storm of January 24-25, 2000 OLR W/m2 00UTC 25 Jan. 2000 SBM: Spectral Bin Microphysics Lin (Bulk) GOES8 IR image SBM Both simulations reasonably reproduce distribution of developed clouds system shown by the satellite observation. The simulation with SBM replicates a complex structure of the clouds better.
Coupling GCE and LIS: First Results • Compare results for SGP ARM June 2002 case, GCE vs. GCE-LIS. • GCE model using prescribed surface fluxes (see Zeng et al. 2007) • GCE-LIS using interactive land surface model, Noah. • Timing and amount of rainfall greatly improved in GCE-LIS simulation.
CSH retrieved Q1 - 10 Year Climatology Tao et al. (2009, J. Climate) Comparison with MERRA/ERA40
Concurrent Visualization (NASA Goddard and Ames) WRF Simulated dBZ - 2 min/1.67 km Shape/size of the eye 3Ice-Hail 3Ice-graupel 2Ice Warm Rain Thompson Lin WSM6 NASA Ames Visualization Group Goddard Mesoscale Dynamic and Modeling Group Katrina 2005 Resolutions: 15, 5 and 1.667 km Grid size: 300x200, , 418x427, 373x382 Starting time: 00Z 8/27/2005 Initial and Boundary Conditions: NCEP/GFS, with bogus (based on 6-h simulated vortex) but no data assimilation Tracer &trajectory analyses
Goddard Multiscale Modeling Framework (MMF) 1) Tropical waves move off the coast of Africa and propagate westward. [ It is known that tropical cyclogenesis can be initialized (or triggered) by these tropical waves. Therefore, accurate simulations of their interactions with small-scale convection are important for improving the simulations of TC genesis. ] 2) The eastward-traveling system in the southern hemisphere (SH) are the so-called the polar vortex, which is most powerful in the hemisphere's winter (JJAS, in the SH). 3) The equatorial Amazon has abundant rain between November and May. During the Brazilian spring season (October/November/December), most of the countries get wetter, except for the Brazilian northeast. 4) In comparison, during this period (winter in the northern hemisphere), mid-latitude periodic frontal systems move eastward across the USA. 5) Near the end of simulations, heavy precipitations appear near the ITCZ
Current - Future Model Improvements (NEWS, MAP and PMM) • Model Improvements Complete the MMF and LIS coupling to study the interaction between cloud systems and land surface processes Complete the MERRA and CRM/SCM coupling Implement an improved microphysics in CRM that is embedded within MMF Investigate the impact of terrain effect on MMF’s performance Couple with 3D GCE MPI, GEOS5, an ocean mixed model, and an non-hydrostatic GCM Improve the MMF cloud - dynamics and test many different MMF configurations Couple the MMF model with the Satellite Data Simulation Unit (SDSU) to identify the strengths and weaknesses of the model microphysical processes • Scientific Applications Conduct 11-year (1998-2008) MMF integrations and examine the physical processes associated with diurnal variation of cloud/precipitation over land Study the explicit cloud-aerosol-radiation interactions by coupling MMF, WRF and GCE with GOCART)\ Investigate the flood/draught and hurricane events in USA Investigate the impact of surface processes on weather/climate events in local, regional scale • MMF (1998, 1999, May 2005 to September 2007), WRF and GCE cloud data is current available through Goddard web site: Website for mesoscale modeling group and cloud library http://portal.nccs.nasa.gov/cloudlibrary/index2.html
Will continue fruitful collaborating with Goddard modeling group (i.e., GMAO) and other NASA centers (JPL, Ames) Issue Need a dedicate high-speed with large storage (or dedicate que) for our meso-scale modeling group