Download
1 / 26
260 likes | 392 Views
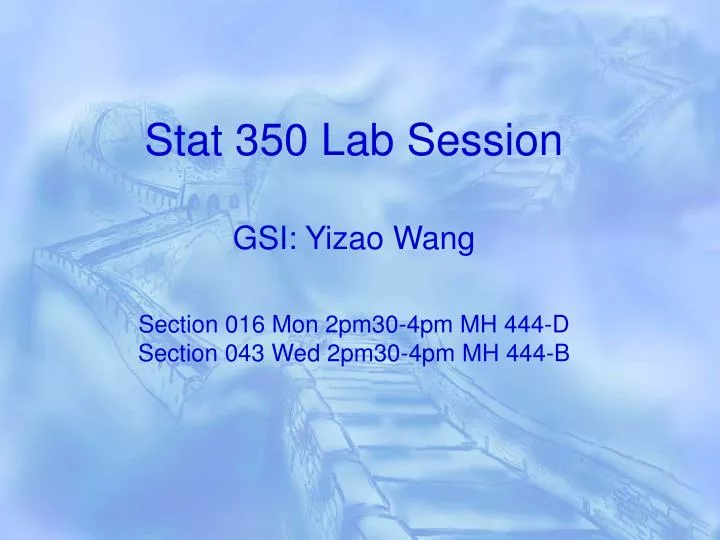
Stat 350 Lab Session GSI: Yizao Wang Section 016 Mon 2pm30-4pm MH 444-D Section 043 Wed 2pm30-4pm MH 444-B. Outlines. Binomial and normal distribution Sampling distribution and CLT (Module 4) Confidential intervals (Module 5, Actv.1) Permission to post forms

E N D
Stat 350 Lab SessionGSI: Yizao WangSection 016 Mon 2pm30-4pm MH 444-DSection 043 Wed 2pm30-4pm MH 444-B
Outlines • Binomial and normal distribution • Sampling distribution and CLT (Module 4) • Confidential intervals (Module 5, Actv.1) • Permission to post forms • Today’s qwizdom questions are anonymous. You don’t have to login with your UMID.
Binomial Distribution Example of B(n,p): coins flipping Flip a coin n times. The probability of getting heads each time is p. The number of heads we get during n times is a r.v. distributed as B(n,p) Another classical example is giving a survey of one ‘yes/no’ question to n random selected persons.
Normal Approximation of Binomial Distribution X ~ B(n,p) • P(X = k) is decided by the parameters…but • When n is large, very difficult to calculate! • Approximation by normal distributionApproximately X ~ N( np,sqrt(np(1-p)) )
Normal Distribution • Normal distribution is very rare in real world, but often a very good approximation, with some nice mathematical properties. • Written as X ~ N(\mu,\sigma) • Z-score (z-statistic) is the standardized X by Z = (X-\mu)//sigma • Z ~ N(0,1) (why we want to standardize X?) • What do the normal distributions look like? How to relate the shape with the two parameters?
Normal Distribution • 10 minues In-lab review (8 questions) CTools\Lab Info\Lab review: Normal Distribution
Parameters vs. Statistics Statistics are random variables. Parameters are constants.
Statistical Inference • Population parameters are unknownconstants. • Statistics are random variables obtained through sampling. • Statistical inference: using statistics to estimateparameters. • Statistics are also called estimators (of parameter).Example: X-bar is the estimator of μ • We need to study the distribution of statistics.(Random variables have fixed distributions.)
Sampling Distribution • The probability distribution of the sample statistics is called its sampling distribution. The X in the pictures is not a random variable… Consider it as X-bar.
Statistical Inference What kind of estimators do we prefer? • Unbiased: the mean of estimator equals parameter. • Small variation: small standard deviation.
Module 4 • Task 1-3 • Objectives: study the influence of the sample size and the distribution of parent population on the sampling distribution. • Sampling Distribution Applet (CTools/lab info)
Summary • The shape of the sampling distribution will depend on the distribution of original parent population as well as the sample size. • The sampling distribution is approximatelynormal when…
4(a) Sampling Dist. of the Sample Mean If the parent popul. is a normal dist. with a mean μ and a stand. dev. σ, then for anysample size, the sample mean will have a __________ dist. with a mean of _____ and a stand. dev. of _____.
4(b) Central Limit Theorem If the parent popul. is NOTa normal dist. but with a mean μ and a stand. dev. σ, then for a largesample size, the sample mean will have a __________ dist. with a mean of _____ and a stand. dev. of _____.
What is the distinction between 4(a) and 4(b)?Choose all that apply... • Shape of parent popul. • Shape of dist. of sample mean • Standard deviation of sample mean • Sample size
True or False • If n is large, the sample data will always have a normal distribution. Clicker in your answer.
Confidence Interval Recall the parameter-statistic comparison… • We never know the true population parameter value. • We use a one-sample (with several observations) statistic to estimate it. • A sample statistic may not be exactly equal to the corresponding parameter value. (why confidence interval?)
Confidence Interval Example: we are 95% confident that the true parameter value lies inside the confidence interval [a, b]. Confidence interval provides a method of stating: • What interval tells:How close the value of a statistic is likely to be to the value of a parameter • What confidence tells:The accuracy of it being that close
Confidence Interval Basic structure for any confidence interval: estimate multiplier standard error Margin of error. The Bigger the margin of error, the wider the CI (why?) The sample statistics such as p-hat, x-bar.
Confidence Interval Two interpretations: • A 95% Confidence Interval: We are 95% confident that the true parameter value lies inside the confidence interval. The interval provides a range of reasonable values for the population parameter. • The 95% Confidence Level: If the procedure were repeated many times (that is, if we repeatedly took a random sample of the same size and computed the 95% confidence interval for each sample), we would expect 95% of the resulting confidence intervals to contain the true population parameter.
Confidence Interval Principles for using CIs to guide decision making: • Principle 1: A value notin a CI can be rejected as possible value of the population parameter. A value in a CI is an “acceptable” or “reasonable” possibility for the value of a population parameter. • Principle 2: When the CIs for parameters for two different populations do not overlap, it is reasonable to conclude that the parameters for the two populations are different.
Confidence Interval • The probability that the true parameter lies in a particular, already computed, confidence interval is either 0 or 1. The interval is now fixed and the parameter is not random, so the parameter is either in that particular interval or it is not.
Module 5 Activity1 • Good summary on p26 • Confidence Interval for Mean Applet (CTools/Lab Info)
# 4: Interpret the (95%) confidence level in terms of a popul. mean. • We are 95% confident that the popul. mean will be in the computed confidence interval. • The computed confidence interval will contain the popul. mean 95% of the time. • 95% of all confidence intervals created with this method are expected to contain the popul. mean.
Before we finish today… Questions or comments?