Download
1 / 30
310 likes | 475 Views
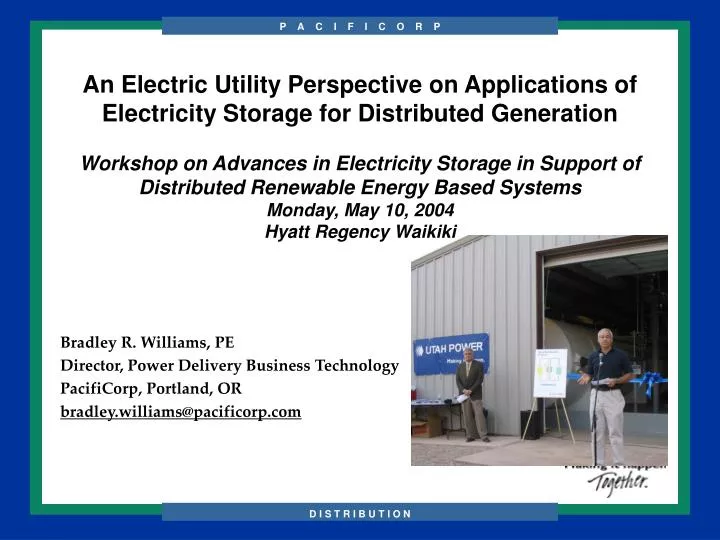
An Electric Utility Perspective on Applications of Electricity Storage for Distributed Generation Workshop on Advances in Electricity Storage in Support of Distributed Renewable Energy Based Systems Monday, May 10, 2004 Hyatt Regency Waikiki. Bradley R. Williams, PE

E N D
An Electric Utility Perspective on Applications of Electricity Storage for Distributed GenerationWorkshop on Advances in Electricity Storage in Support of Distributed Renewable Energy Based Systems Monday, May 10, 2004 Hyatt Regency Waikiki Bradley R. Williams, PE Director, Power Delivery Business Technology PacifiCorp, Portland, OR bradley.williams@pacificorp.com
PacifiCorp Quick Facts • 1.5 million electric customers in six Western states • Doing business as Pacific Power and Utah Power • Low-cost, reliable energy producer • 8300 megawatts of generation capacity from coal, hydro, gas-fired combustion turbines, geothermal, co-generation and renewable wind power • 6,400 employees in the United States, headquartered in Portland, Oregon • President and CEO: Judi Johansen • Part of the ScottishPower Group, which additionally provides energy and other utility services to 5.5 million customers in the United Kingdom.
Load Concentration Substation CB Feeder capacity limit DG Utility Distribution Applications best Suited to Distributed Electricity Storage • High loading - existing infrastructure at full capacity • High Costs to increase capacity and/or build transmission • Slow to moderate load growth to leverage best asset deferral benefit • Feeder voltage/reactive power (var) support needed • Difficult access to stable fuel source • Difficult permitting process for DG combustion engines emissions
Rattlesnake#2225kV Feeder • Environmentally Pristine Southeast Utah • East of Moab • East of Arches National Park • Along Colorado River valley • 209-mile long 25kV feeder, with 3-line regulators & 7-reclosers • Possible denial of new connects because feeder cannot supply any significant amount of new load without causing low voltage to existing customers. • Because feeder is so long, reliability and power quality is low leading to Public Service Commission Complaints. PacifiCorp agreed to fix. • Traditional alternatives to add capacity and improve service are very costly and environmentally difficult. • Demonstrated distribution benefits of VRB energy storage as part of PacifiCorp's DG Strategy – 2 MWh, 250kW VRB-ESS (expandable to 1MW) in Castle Valley, Utah Castle Valley
Utility Electricity Storage Applications Power quality and reliability applications Energy management applications Spinning and standby reserve 100 MW Black start Load levelling/following Frequency 10 MW control Load factor increase Capacity deferral Voltage support Power rating 1 MW Integration of renewables VAR support Tariff trading Transmission stability 100 kW Power quality Peak shaving Un-interruptible power supplies 10 kW 0 0 1s 10s 1 min 30 min 1 h 2 h 4 h 8 h Storage inventory
Electricity Storage Technology Alternatives UPS Market 100-MW and above 10-MW 1-MW Pumped storage Compressed Air Energy Storage (CAES) Large-scale batteries Lead-acid NAS VRB ZBB • Flywheels • Batteries • Li Ion • NiMH • Capacitors
PacifiCorp’s View of Electricity Storage • Excellent progress in electricity storage technology & power electronics • Redox Flow Cell stores charged electrolytes separate from cell for greater kWh storage capability. Best distributed resource applications. • Efficiency: 60-85% • Best Applications: • Deferred Power Delivery assets: Peak Shaving, load following, dynamic frequency control, volt-var support • Large renewable wind and solar projects. Leveling applications. • Premium Power: Industrial/Commercial High 9’s Availability (99.999% available) • Opportunity for early adopters • Looked at a number of storage technologies: Regenesys, ZBB, VRB, others • Selected VRB Power Systems due to efficiency, availability, and scalability (smaller size initially to prove the technology).
What is a Vanadium Redox Battery? • The VRB-ESS is a “green” technology. It has no emissions, and does not contain heavy metals. Most other energy storage systems rely on toxic substances such as lead, zinc or cadmium. The electrolyte used in the VRB-ESS has an indefinite life and is • completely reusable. Vanadium Redox Batteries are a type of energy storage system (“VRB-ESS”) - flow batteries capable of storing electrical energy and deploying it back to the grid when required. The VRB-ESS is charged like any other battery, but the energy is stored by chemical changes to the electrolyte. The electrolyte is a solution of ionic forms of vanadium in a dilute sulfuric acid that are electrochemically oxidized or reduced to store the energy. The acidity level of the electrolyte is no greater than a conventional car battery. The electrolyte is pumped from separate plastic storage tanks across proton exchange membranes in the cell stacks, creating a current. The reaction is reversible, allowing the battery to be charged, discharged, and recharged with high efficiency. Castle Valley VRB System
VRB Energy Storage System Components • Electrolyte storage tanks • Cell stacks (with proton exchange membranes & carbon felt electrodes) • Pumps to move the electrolyte fluid through the cell stack • ac/dc Inverter and power conditioning • VRB ESS Control system The battery provides DC power. Therefore, an inverter is used to convert it to alternating current when it is returned to the electric delivery system. Also involved: control, monitoring, and temperature regulation systems V2+ and V3+ V4+ and V5+ DC Power AC Power
VRB Chemistry - dc Power + Vanadium sulfates in H2SO4 V2+ V3+ + e- [1] V5+ + e- V4+ [2] • Based on reduction and oxidation of different ionic forms of Vanadium. • Chemical energy can be stored indefinitely (very low discharge rate). • Very fast conversion response: less than 1 millisecond to change from charging to discharging. V2+/V3+ V4+/V5+
Potential VRB-ESS Utility Applications • Load Leveling (Peak Shaving) • The VRB Energy Storage System can reduce the peak of a customer’s energy load as seen by the distribution system. This enhances utilization of assets on the electrical grid and manages customer energy demand. • Ancillary Services to Utilities • Reserves - Spinning, Standby, Replacement - In the event of the loss of output from a supply source or an unexpected change in system demand, the VRB-ESS can immediately provide the required power to make up the shortfall. • Constraint Relief & Capital Deferment • The VRB Energy Storage System is a means of buffering both the flow and supply of power and thereby increase the associated delivered capacity in MW on a network path that is otherwise constrained. • Power Quality & Reliability– demand side management • Uninterruptible Power Supply (UPS) – emergency power backup for loss of AC, voltage sags, dips, etc. • Voltage support & flicker compensation • Power factor management • Quality of Supply (QOS) – supply side management • Reactive power provision • Capacity extension – improves voltage regulation • Power factor management • Renewable Energy Capacity Support • The VRB-ESS can serve as a buffer between a variable supply sources and the firm competitive requirements of a power contract – which could add value to non-firm resources such as wind and photo-voltaic (PV). It could also provide stabilization of wind turbine output and is a source of reactive energy.
Example Peak Shaving High Cost Low Cost
The VRB can be used to store solar and wind energy Using a VRB can smooth the power supplied, making it more constant The VRB can provide reactive energy through the AC/DC converter The VRB is an environmentally friendly alternative to diesel generators and larger lead acid batteries V R B Renewable Energy Applications • King Island – Hydro Tasmania • 800kWh VRB Integration with Remote Wind & Diesel Systems • Reduced emissions – 47% • Saved fuel costs – Load factor is 28% or 10,000litres/day average. Reduced by 1.5million/litres/year • Reduced Operating and Maintenance costs • Improved power system stability and enhance power quality Wind output is variable so capacity is discounted by > 75% VRB can firm supply and increase capacity and efficiency AC/DC Converter renewable energy source
Castle Valley VRB Enclosure Footprint (m2) per capacity2.0MWh – 250kW • Castle Valley enclosure 7300 sq. ft. designed for expansion, room to work, and visitors (being 1st VRB in North America). • Minimum VRB foot print design for 1MW-4hrs = 3200 sq ft.
Modular Design • Sumitomo (Japan) – 50kW VRB Cell Stacks have 5X short duration overload rating for PQ support and major disturbance mitigation. • Each stack size = 4.2-ft X 3.2-ft X 3.6-ft (1.3m X 1.0m X 1.1m)
Electrolyte Storage Tanks • 58-ft long, 9.5-ft diameter. 70,000 liters capacity • Fiberglass (double wall) construction with leak detection sensors.
Inverter • TSI/Eskom QuPS 250kW, 300kVAR inverter • 1200A, Vdc=200-300 volts with constant power output • Internal ac bus = 600volts (IEEE 514 harmonic filter capability) • Overload capability = 200% for 10-seconds, 150% for 5-minutes
Operating Parameters • Temperature range - 5ºC to 40ºC • Electrolyte concentration – 1.6 to 2.4 Mole/liter • Sulphuric acid concentration 2 to 4 Mole/l • Electrolyte Hazardous classification: EEC 8, 6.1 • Speed of response - <1ms • SG – 1.36 to 1.47 kg/liter
Castle Valley VRB Project Status • Initial operations in startup and testing in November 2003 • Continuous full power daily cycling operations since March 2004 • On-going monitoring and performance testing • Minor Capacity enhancements Underway
PacifiCorp VRB Future Plans • Advanced application development: • Advanced power quality applications • Advanced islanded operations • Adaptive charge/discharge energy arbitrage control algorithms • Advanced dynamic voltage control algorithms • Dynamic stability control algorithms • Wind farm application studies • DOE Wyoming Wind Farm / Energy Storage Study. • Increases to capacity through: • Additional cell stacks • Higher capacity inverter • Increased molarity of the electrolyte • Can relocate to new site once transmission line and sub is built • Investigating future telecom site and substation battery replacements
Storage Business CaseSoutheastern USA 2004 Generator (1,000kW 6 hours/day 320days/y) –1,920,000kWh/year • Fuel ($9/MMbtu) and O&M costs ($0.0168/kWh) per year = $214,000 • CAPEX cost per year (20 years @ 7%) = $99,523 • Equivalent cost of energy = $0.1634/kWh VRB-ESS 1,000 kW 1,000kVAR for 6 hours storage • Fuel cost (off peak purchases $0.013/kWh @80% efficiency) and O&M per year = $45,000 • CAPEX cost per year (20 years @ 7%) = $267,000 • Equivalent cost of energy = $0.1625/kWh • Ancillary services are additional value streams that could be derived by a storage system, and a hedge against gas price volatility
Cost Benefit Analysis Arbitrage – East Coast • Out of City generation = 300MW • Unable to deliver during peak daytime loads due to line constraints • Option – Install several distributed Energy Storage systems locally to the loads. • Cost of Storage installation $320/kWh – 10MW, 10MVAR, 10 hours NPV = $5.6million ROI AT = 23%
Cost Benefit Analysis Industrial facility - NY • Maximum Demand – 3,862kW • Minimum Demand – 680kW • Load factor 60% • Storage – 800kW x 6 hours 75% round trip efficiency • Storage shifts 6,230kWh usage per day from peak pricing to off peak pricing and MD reduced 800kW. • Annual saving based on current tariffs - $292,000 • Simple payback < 6 years
Industrial Consumer Solution Profile Without Storage Profile With Storage Courtesy Regenesys – Mr. Mark Kuntz
Conclusion - Lessons Learned from Utility Energy Storage Application • Focus on best applications – this can make or break the project. • Cost – CAPEX and O&M (life cycle) – Maximize efficiency, minimize maintenance requirement • Reliability and Availability – Must be there when we need it! • Must be large enough to have an impact (MWh). • Speed of response to an event - Can it be controlled and dispatched – risk to system • Grid stability impacts – voltage and protection dynamic interactions • Permitting – ease and time to obtain permits • Footprint – How Big? Can it be sited at customer’s premise or substation • Must breakthrough utility Technology bias – just build more lines and substations – new technology is too risky and subject to disallowance.