Download
1 / 44
460 likes | 480 Views
Market Risk Analysis. LIB. Prof Ian Giddy Stern School of Business New York University. Risk Management is a Process. Risk Management. Define. Measure. Manage. Monitor. Distribution of market moves and portfolio values Includes market correlations Reprice portfolio

E N D
Market Risk Analysis LIB Prof Ian Giddy Stern School of Business New York University
Risk Management is a Process Risk Management Define Measure Manage Monitor
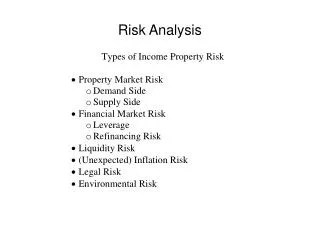
Distribution of market moves and portfolio values • Includes market correlations • Reprice portfolio • Aggregate risk measures within confidence interval • Non-linear risk measures • Delta, gamma, vega, theta, rho • No aggregation of risk measures across asset classes or instruments • Limited market scenarios that could include market correlations • Reprice portfolio • Parallel and non-parallel curve shifts • Aggregate portfolio risk per scenario • Linear risk measures • Swap/ bond equivalents • Notional Amounts Market Risk Measurement Where are we now? Where do we need to be? Option Sensitivity Measures ValueatRisk Duration/ PVof01 Volumetric Simulations
Model 1 Base rates/ Currency market conditions Interest Rates Model 2 • Volatilities • Correlations Equities Model 3 Commodities Historical rates/ Discrete scenarios Model 4 Currencies An Overview of Corporate VAR Transactional Database Business 1 Portfolio Database Business 2 Projected Revenues Business 3 Projected Operating Costs Estimates of Cash Flow Distribution Mean Impact on Earnings
Summary of “Value at Risk” Reporting “At close of business each day tell me what the market risks are across all businesses and locations.” Dennis Weatherstone, JP Morgan Logical steps: • Economic-value accounting (need market prices or models) • Volatilities and correlations of market prices • Measurement of Risk Exposure • Management of risk • Market-price based performance measurement
Portfolio Diversification • DM position • A$ position • S$ position • FIM position Net effect?
Predict Volatilities RiskMetrics (exponential smoothing) BIS (rolling historicals)
RiskMetrics Method Compared • Other methods include: • Implied volatility from option prices • Structured volatility models (ARCH, GARCH, EGARCH) • Stochastic volatility The task of most models is to find some historical pattern of volatility and to use this to forecast volatility, which seems to “cluster
Get Volatility and Correlation Estimates...eg from RiskMetrics On the World Wide Web, RiskMetrics publications and data may be found at: http://www.jpmorgan.com and http://www.riskmetrics.reuters.com
RiskMetrics Coverage ...plus about a dozen commodities,term structure of yields, more exotics... each day, about 450 volatilities and 100,000 correlations.
Single-Asset Value-at-Risk Potential loss (5% probability) =Amount at risk * Adverse price/rate move per period (1.65SD) Probability 68% 95% > 99% + 3 – 3 – 2 – 1 0 + 1 + 2 Percentage change in exchange rate
Single-Asset Value-at-Risk: Example A Single Position (Example: $100,000 AUD) Volatility
Measuring Portfolio Exposure: Two Assets The variance of a 2-asset portfolio, : where wAand wBare the weights of A and B in the portfolio. To evaluate the gains and structure of a portfolio, we need a variance-covariance matrix: $ AT RISK VOL. AUD BEF AUD $50,000 2.909 % 1 BEF $50,000 4.573% -0.273 1
Two-Asset Value-at-Risk: Example Two Positions (Example: $100,000 AUD & BEF) Volatility & Correlation
Return and Risk, Generalized Portfolio return: where wi are the weights of each asset in the portfolio. (Expected return is simply the weighted sum of the individual asset returns.) Portfolio variance: When i = j, the term wiwj becomes wi2
Portfolio Value at Risk + = Value-at-Risk Mean
Portfolio Risk Simulation • • Gov't Bonds Zero Cashflow • • RiskMetricsª • • USD Base. Vols. & correls. as of May 04, 1995. • • • • AUD • • BEF • • CAD • • DKK • • FFR • • DEM • • ITL • • JPY • • NLG • • ESB • • SEK • • CHF • • GBP • XEU • • USD • Total • • 1 Mo • • • 15 • 22 • • 37 • • 3 Mo • • • -200 • • 20 • -30 • • • 160 • - 50 • • 6 Mo • • 25 • • • -5 • 20 • • 12 Mo • • • -105 • - 105 • • 2 Yr • • 0 • • 3 Yr • • 0 • • 4 Yr • • 0 • • 5 Yr • • 0 • • • 7 Yr • • 0 • • 9 Yr • • 0 • ($000) • • 10 Yr • • 0 • • 15 Yr • • 0 • RISK • • 20 Yr • • 0 • • 30 Yr • • 0 • Equity • • 0 • • • Implied • • • - 196.1 • • • 59 • 22 • -29 • • • 54 • -145 • FX • • Spot • • 23 • • 23 • • • • Net • • • - 196.1 • • • 82 • 22 • -29 • • -122 • Int. • • • 740 • • • 502 • • • 262 • 5 • 139 • • 400 • • • Eq. • • 8516 • • Fx • • • 5,048 • • • 4265 • 1383 • 1820 • • divers. • • • -200 • • • -347 • -6 • -83 • • -451 • • 8805 • • Net • • • 5,350 • • • 4181 • 1383 • 1876 • • 400 A Management-Friendly Report • An example is FourFifteen™, named after J.P. Morgan's market risk report produced at 4:15 p.m. each day. • The "4:15 Report," a single sheet of paper, summarizes the Daily Earnings at Risk for J.P. Morgan worldwide.
The Next Step: Efficient Hedging 30% HEDGE (VAR $25M, COST $0.8M) NO HEDGE (VAR $46M, COST $0)
The VaR Management Cycle This process can be undertaken on a monthly cycle basis, as the institution revises its estimates of future business and as new data on volatilities and correlations are acquired.
Value at Risk: Assessment Value at Risk and RiskMetrics: • A method for quantifying risk in dynamic, uncertain environments • Based on the observation that volatilities and correlations are somewhat persistent • The RiskMetrics estimates are in the ballpark of other, more sophisticated, methods
Is VAR Valid? • Are we measuring the right thing for our purpose? • Since we are measuring deviations from expected, do we have a good approximation of the distribution of changes? • How good are our forecasts of volatilities and correlations? • How good are our exposure measures? • How good are our valuation models?
Alternatives • Worst-case analysis • Scenario analysis • Historical simulation • Monte-Carlo simulation • Sensitivity measures
Mean What Happens in the Tails? For credit and capital purposes, we want to know about the probability, size and impact of extreme events. Worst-Case Analysis: How skewed? How many? How large? Probability of extreme events?
EMU Scenario Analysis for Publicorp Baseline Scenario This scenario assumes that current predictions of volatilities and correlations are valid for Publicorp’s FX risk management horizon. As is shown in the table below, the monthly volatility -- defined as the standard deviation of percentage changes in the dollar value of foreign currencies -- ranges from 1.69% for the Canadian dollar to 2.55%% for the Swedish Krona. The correlations between the DM and the core European currencies are very high - for example, the French franc has a 98% correlation with the DM - while the other European currencies have a positive but lower correlation coefficient. In particular, the British pound’s correlation with the DM is 55%. The table shows that the Value-at-Risk (VaR) for Publicorp’s existing, unhedged positions is $1.222 million. EMS Crisis Scenario Under this scenario, we assume that the “inner core” European currencies, the mark, guilder and Austrian schilling, remain closely linked, but that the correlations between German mark and the Belgian franc, the French franc, Finnish markka, Spanish peseta and Portuguese escudo all fall to 65%. The result of this is to increase the VaR to $1.291 million -- not a dramatic increase. EMS Convergence Scenario The third scenario is one in which the correlations among all the major European Union currencies rise to 100%. This could be regarded as the “single currency in Europe” scenario. Because of Publicorp’s offsetting long and short positions in these currencies, the result is a reduction in currency exposure: the monthly VaR drops to below $1 million.
The Alternative: Full-Valuation Methods Prices, rates, and estimated variances and covariances Monte Carlo Simulation Generate Scenarios Delta-Gamma Valuation Full Valuation MODELS Estimated value changes Distribution of Values
Using a VaR Measure for Trading-Portfolio Performance Evaluation • The Sharpe ratio. • (actual return relative to actual risk) • The risk ratio. • (actual return relative to prospective risk) • The efficiency ratio. • (actual risk relative to prospective risk) • Use risk-return performance measures to evaluate individual trader performance.
Performance Measurement: Roadmap • Map exposures • Map risks • Manage risks • Measure performance • Take actions to improve performance FINANCIAL SIDE • EXPOSURES • Known • Anticipated OPERATIONAL SIDE MARKET PRICES • RISK MEASUREMENT • VaR • Worst-case scenario, etc. MARKET VOL & CORR. • RISK MANAGEMENT • Hedging • Investment or trading • PERFORMANCE MEASUREMENT • Relative return • Relative risk. • INCENTIVES • ALLOCATION OF RESOURCES.
Treasury Performance Measurement: Conclusion • Performance evaluation: “the science of attribution” • Why did we make/lose money? • The market; the FX manager; my lousy instructions? • How much should I tip this FX manager? • Would I use this method again? • How good is my performance measurement system?
Summary: Market Risk Management is a Process Risk Management Define Measure Manage Monitor
Ian H. Giddy Professor of Finance Stern School of Business New York University 44 West 4th Street, New York, NY 10012, USA Tel 212-998-0332; Fax 212-995-4233 Email: ian.giddy@nyu.edu World Wide Web: http://giddy.org