Download
1 / 1
10 likes | 147 Views
Figure 10: Original image at 100%, enlarged 200% and 400%. Figure 5. Figure 6. Figure 7. Figure 8. The Research Project Team A : Member names . Poster Basics/Poster Layout. Content. Changing Column Layout. Importing Graphs & Photos.

E N D
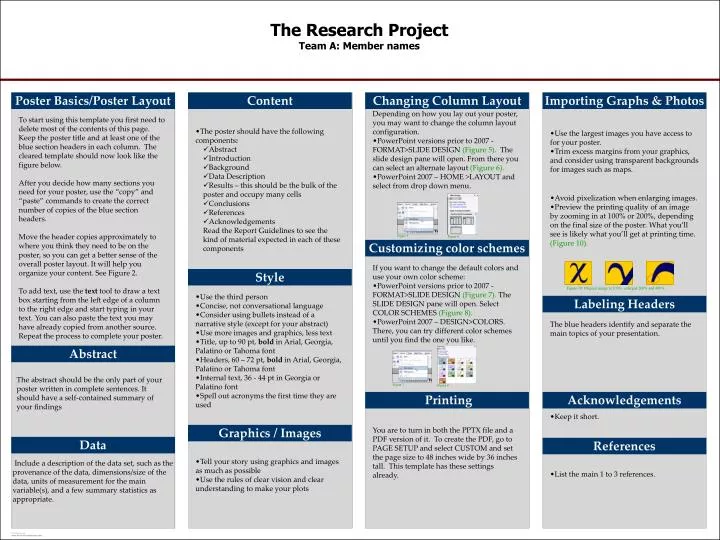
Figure 10: Original image at 100%, enlarged 200% and 400%. Figure 5 Figure 6 Figure 7 Figure 8 The Research Project Team A: Member names Poster Basics/Poster Layout Content Changing Column Layout Importing Graphs & Photos • Depending on how you lay out your poster, you may want to change the column layout configuration. • PowerPoint versions prior to 2007 - FORMAT>SLIDE DESIGN (Figure 5). The slide design pane will open. From there you can select an alternate layout (Figure 6). • PowerPoint 2007 – HOME >LAYOUT and select from drop down menu. To start using this template you first need to delete most of the contents of this page. Keep the poster title and at least one of the blue section headers in each column. The cleared template should now look like the figure below. After you decide how many sections you need for your poster, use the “copy” and “paste” commands to create the correct number of copies of the blue section headers.Move the header copies approximately to where you think they need to be on the poster, so you can get a better sense of the overall poster layout. It will help you organize your content. See Figure 2. To add text, use the text tool to draw a text box starting from the left edge of a column to the right edge and start typing in your text. You can also paste the text you may have already copied from another source. Repeat the process to complete your poster. • The poster should have the following components: • Abstract • Introduction • Background • Data Description • Results – this should be the bulk of the poster and occupy many cells • Conclusions • References • Acknowledgements • Read the Report Guidelines to see the kind of material expected in each of these components • Use the largest images you have access to for your poster. • Trim excess margins from your graphics, and consider using transparent backgrounds for images such as maps. • Avoid pixelization when enlarging images. • Preview the printing quality of an image by zooming in at 100% or 200%, depending on the final size of the poster. What you’ll see is likely what you’ll get at printing time. (Figure 10). Customizing color schemes • If you want to change the default colors and use your own color scheme: • PowerPoint versions prior to 2007 -FORMAT>SLIDE DESIGN (Figure 7). The SLIDE DESIGN pane will open. Select COLOR SCHEMES (Figure 8). • PowerPoint 2007 – DESIGN>COLORS. There, you can try different color schemes until you find the one you like. Style • Use the third person • Concise, not conversational language • Consider using bullets instead of a narrative style (except for your abstract) • Use more images and graphics, less text • Title, up to 90 pt, bold in Arial, Georgia, Palatino or Tahoma font • Headers, 60 – 72 pt, bold in Arial, Georgia, Palatino or Tahoma font • Internal text, 36 - 44 pt in Georgia or Palatino font • Spell out acronyms the first time they are used Labeling Headers The blue headers identify and separate the main topics of your presentation. Abstract • The abstract should be the only part of your poster written in complete sentences. It should have a self-contained summary of your findings Printing Acknowledgements • Keep it short. You are to turn in both the PPTX file and a PDF version of it. To create the PDF, go to PAGE SETUP and select CUSTOM and set the page size to 48 inches wide by 36 inches tall. This template has these settings already. Graphics / Images Data References • Tell your story using graphics and images as much as possible • Use the rules of clear vision and clear understanding to make your plots Include a description of the data set, such as the provenance of the data, dimensions/size of the data, units of measurement for the main variable(s), and a few summary statistics as appropriate. • List the main 1 to 3 references.


![Jeanna Vogt [other team member names removed]](https://cdn2.slideserve.com/4847002/slide1-dt.jpg)