Download
1 / 64
640 likes | 779 Views
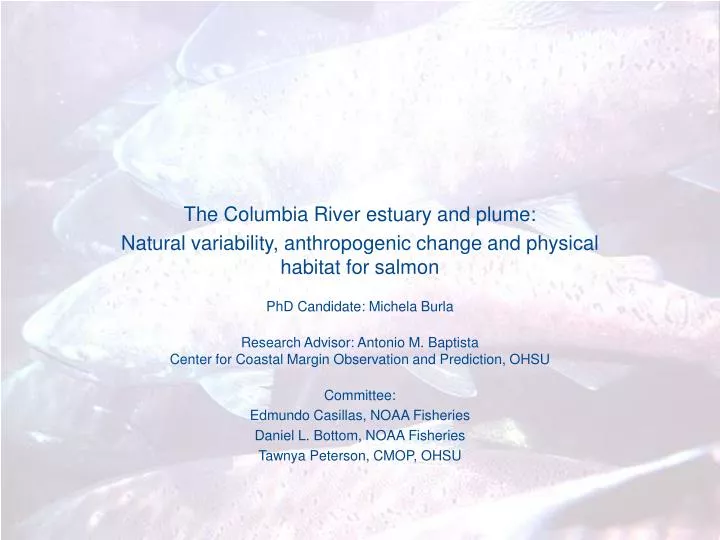
The Columbia River estuary and plume: Natural variability, anthropogenic change and physical habitat for salmon PhD Candidate: Michela Burla Research Advisor: Antonio M. Baptista Center for Coastal Margin Observation and Prediction, OHSU Committee: Edmundo Casillas, NOAA Fisheries

E N D
The Columbia River estuary and plume: Natural variability, anthropogenic change and physical habitat for salmon PhD Candidate: Michela Burla Research Advisor: Antonio M. BaptistaCenter for Coastal Margin Observation and Prediction, OHSU Committee: Edmundo Casillas, NOAA Fisheries Daniel L. Bottom, NOAA Fisheries Tawnya Peterson, CMOP, OHSU
The Columbia River 3,200-10,500 m3s-1 2001: 1,800 m3s-1 1996: 24,500 m3s-1 1800s 1930s-70s Climate variability and change Late1800s -
Salmon in the ecology, economy and culture of the Pacific NW 85% of Oregonians want salmon to be saved: 35% part of NW heritage 36% measure of region’s environmental health 15% commodity value (The Oregonian, Dec 1997)
Columbia River Basin Salmon Salmon catch in the Columbia River, 1866-1994 Dam development Habitat degradation from mining, logging, irrigation (Lichatowich, 1999)
Salmon recovery strategies in the CR Production view Population view Technological fixes and hatchery production Continuum of marine, estuarine, and riverine habitats critical to preserve the diversity of salmon life histories Paradigm shift (Lichatowich, 1999; Bottom et al, 2005, 2008; Fresh et al, 2005; NPPC 1997, 1998, 2009)
CORIE/SATURN: A coastal-margin observatory for the CR estuary-plume-shelf Modeling system Observation network Information management • Goal: to deliver quantifiably reliable environmental information, at the right time and in the right form to the right users. • Can complex models that simulate the physical environment provide credible and useful answers to the decision makers ? • Opportunity and challenge: can high-resolution numerical models address the time scales relevant to investigate the impact of anthropogenic activities in the context of natural variability and climate change? ELCIRC SELFE
Research Objectives Introduction Research Objectives I. Seasonal and interannual variability of the CR plume II. The CR plume and salmon survival III. Salmon habitat opportunity in the CR estuary IV. Future work: residence times in the CR estuary V. Conclusions Q1a: To what extent is the CORIE/SATURN modeling system capable to reproduce known dynamics of the CR plume? Q1b: Can multi-year simulation databases of circulation further our understanding of the seasonal and inter-annual variability of the plume in its response to river, ocean and atmospheric forcings?
Research Objectives Introduction Research Objectives I. Seasonal and interannual variability of the CR plume II. The CR plume and salmon survival III. Salmon habitat opportunity in the CR estuary IV. Future work: residence times in the CR estuary V. Conclusions Q2: Does the CR plume play a role in the survival of juvenile salmon migrating from the Columbia River to the ocean? Through what mechanisms? Do inter-annual variability and climate and ocean regimes modulate that role?
Research Objectives Introduction Research Objectives I. Seasonal and interannual variability of the CR plume II. The CR plume and salmon survival III. Salmon habitat opportunity in the CR estuary IV. Future work: residence times in the CR estuary V. Conclusions Q3: Can we use the high-resolution modeling capabilities of CORIE/SATURN to investigate the impact of natural variability and anthropogenic change on physical habitat opportunity for salmon in the CR estuary?
Research Objectives Introduction Research Objectives I. Seasonal and interannual variability of the CR plume II. The CR plume and salmon survival III. Salmon habitat opportunity in the CR estuary IV. Future work: residence times in the CR estuary V. Conclusions Q4: How does variability in river, ocean and atmospheric forcings modify migration paths and residence times in the CR estuary and plume, potentially affecting survival success for outmigrating juvenile salmon?
Outline Introduction Research Objectives I. Seasonal and interannual variability of the CR plume II. The CR plume and salmon survival III. Salmon habitat opportunity in the CR estuary IV. Future work: residence times in the CR estuary V. Conclusions
Part I Introduction Research Objectives I. Seasonal and interannual variability of the CR plume II. The CR plume and salmon survival III. Salmon habitat opportunity in the CR estuary IV. Future work: residence times in the CR estuary V. Conclusions Courtesy NOAA
Known patterns of variability of the CR plume • Two winter plume patterns in response to wind (Hickey et al, 1998) • - Thicker, northward, coastally attached • Thin, west to northwestward • Rapid changes in plume orientation and shape resulting from wind reversals (Fiedler and Laurs, 1990; Hickey et al, 1998) • Frequent summer bi-directional plume (Garcia Berdeal et al, 2002; Hickey et al, 2005) • Interannual variability associated with variability in river discharge and wind forcing (Thomas and Weatherbee, 2006) Classical view Winter Summer Barnes et al, 1972
A numerical exploration of CR plume variability Q1a: To what extent is the CORIE/SATURN modeling system capable to reproduce known dynamics of the CR plume? Q1b: Can multi-year simulation databases of circulation further our understanding of the seasonal and inter-annual variability of the plume in its response to river, ocean and atmospheric forcings? Analysis of plume variability | Evaluation of model skills Model-obs and inter-model comparisons 1999-2006 simulation database (SELFE) Ability to represent known dynamics Suite of skill scores Conditional distributions of modeled salinity Seasonal and monthly climatologiesand anomalies of surface S Integrative plume metrics EOF analysis
Plume variability: River forcing • Seasonal • Sustained peaks during the spring snowmelt freshet • More episodic peaks generated by winter storms • Flows decreasing through the summer into the fall • Interannual • Intensity of winter storms and timing and intensity of the freshet (though reduced by flow regulation) • Highest flows of winter and spring 1999, followed by 2000 • 2001 drought
Plume variability: wind forcing • Seasonal • Winter downwelling -favorable winds to the north • Summer upwelling- favorable winds to the south • Stronger wind stress during winter storms • Interannual • Intensity of winter storms and timing of spring transition • E.g. strongly enhanced downwelling of Feb 1999 • Weak northward winds and reversals of Feb 2003 • Upwelling winds of Feb 2005 and 2006 • Late spring transition of 2000 and 2005
Plume variability:seasonal climatologies Summer Winter Climatologies of the surface S, generated from our 8-year simulations, are consistent with the known prevailing seasonal patterns DB14
Plume variability: plume metrics Plume area Multi-year simulations of the 3D salinity field Area of the surface plume Integrating over space Plume volume Salinity cutoff = 28 psu Plume average depth model output@ 15 min intervals Plume location (centroid) 1999
Plume variability: volume • Delayed response to increases in CR discharge • Largest volumes formed following the freshet season of 1999 and 2000, with seasonally larger volumes characterizing, in most years, the stormy winter season and the spring. • 30-psu plume varied, in average-flow years, within a range comparable to the 20-110 km3 estimated in Hickey et al (1998) DB14
Plume variability: average depth 2002 Plume average depth (m) 18 12 6 0 Wind (ms-1) Jan Feb Mar Apr May Jun Jul Aug Sep Oct Nov Dec The ratio of plume volume to its surface area (average depth) in the simulations captures the prompt response of the plume to wind reversals DB14
Plume variability: depth and orientation • Time series of plume depth at the northward inner shelf location consistent with the two basic winter structures observed in (Hickey et al, 1998) • Agreement with observed shallow summertime plumes and deeper wintertime plumes • Summer plume consistently present at ogi01 in 1999 (high discharge and consistent southward winds) • Occasional appearances at ogi01 if low flows and frequent wind reversals • Bi-directionality observed by Hickey et al. (2005) for the CR summer plume may apply at times to the winter plume as well. • Episodic winter plume reversals confirmed in CORIE/SATURN observations
Plume variability: EOF analysis - winter Our analysis: Winter months: Nov-March of all years 1999-2006 Hickey et al, 1998: EOF analysis of 1 m salinity survey data, October 25-November 28, 1990 EOF1: 57% CR plume when separated from the coast and oriented northward of the mouth EOF2: 18% CR plume to the north but hugging the coast.
Evaluation of model skills: methods • Duplicative realizations of circulation database: • DB14 – SELFE (upwind ) • DB11 – ELCIRC (ELM) • DB13 – SELFE (ELM) • Skill scores • RMSE • Brier skill score= 1-MSE/MSEref • Correlation skill score, ρMO • (Unconditional) model bias: MB=(E(M)-E(O))/ σO • Normalized standard deviation for the model predictions, σM/σO • Distributions of modeled salinity conditional on the value of the observed salinity
Evaluation of model skills: scores • RMSE is in most cases substantially reduced in DB14, except at deeper stations (at 5 and 20 m depth at the three RISE buoys) • MB is consistently negative for DB11, and markedly larger, in absolute value, than the bias in DB14 (except at deeper stations) excessive freshness in ELCIRC simulations • Larger biases at depth in DB14 are due to the use of terrain-following coordinates • Despite the clear overall superiority of SELFE in DB14, ρMOreveals instances where DB14 simulations perform worse than DB11 in reproducing variability in observed salinity • DB11: variability in modeled salinity is generally distinctively higher than the variability in observed salinity (σM>σO);DB14: σO>σM • Consistently higher Brier skill scores for DB14 than for DB13: improvement in adopting an upwind method in place of ELM to solve the transport equation
Evaluation of model skills:conditional distributions OGI01 2001 OGI01 2001 OGI01 1999 OGI01 1999 DB14 (SELFE) DB11 (ELCIRC) RISEN -1 m 2004 Percentiles: 10th and 90th RISEN -1 m 2004 RISES -1 m 2004 RISES -1 m 2004 25th and 75th 50th (median)
Part I: Summary of findings Introduction Research Objectives I. Seasonal and interannual variability of the CR plume II. The CR plume and salmon survival III. Salmon habitat opportunity in the CR estuary IV. Future work: residence times in the CR estuary V. Conclusions • Correctly reproduced known patterns of variability. • Interannual variability around climatological seasonal conditions in agreement with the results of T&W (2006). • Integrative metrics proved valuable in capturing the evolution of the CR plume in its response to variability in river and wind forcing. • Differential influence of the CR plume on the Washington shelf across the years with potential implications on productivity. • 8-year EOF analysis confirmed the two basic winter structures observed in 1990-91 (Hickey et al, 1998), indicating generality of the result. • First two EOF modes clearly related to the two key forcing mechanisms of seasonal and inter-annual variability of the CR plume
Part I: Summary of findings Introduction Research Objectives I. Seasonal and interannual variability of the CR plume II. The CR plume and salmon survival III. Salmon habitat opportunity in the CR estuary IV. Future work: residence times in the CR estuary V. Conclusions • Prevalent bi-directionality of summer plume regardless of interannual variability. • Short-term bi-directional plumes, previously observed or modeled only in summer, can occasionally develop also in winter as a result of episodically strong upwelling-favorable winds. • Confirmed overall superiority of SELFE in the multi-year DB14 simulations (small RMSE and bias) and excessive freshness of DB11 simulations (ELCIRC) . • DB14, to an extent, achieved better performance in terms of RMSE –even when exhibiting weaker correlation with the observations– by producing results that are conservatively less variable than the corresponding observations • No one score is adequate by itself to fully evaluate the skill of a model
High quality of CORIE/SATURN simulations provides a rationale for using integrative metrics of CR plume structure to investigate the ecological implications of plume dynamics Q2: Does the CR plume play a role in the survival of juvenile salmon migrating from the Columbia River to the ocean? Through what mechanisms? Do inter-annual variability and climate and ocean regimes modulate that role? Photo courtesy E. Keeley
Part II Introduction Research Objectives I. Seasonal and interannual variability of the CR plume II. The CR plume and salmon survival III. Salmon habitat opportunity in the CR estuary IV. Future work: residence times in the CR estuary V. Conclusions Photo courtesy E. Keeley
Ocean environments in Pacific salmon survival • Both freshwater and ocean environments contribute substantially to egg-to-adult salmon mortality • For the ocean phase of salmon life history, most mortality occurs within the first few weeks or months of ocean residence • Effort in the last decade into understanding the relationship between Pacific salmon production and climate variability patterns, such as ENSO and PDO • Local marine environments (ocean-shelf upwelling, river plumes) may play as large a role in the early marine survival of salmon as the regime shifts operating at broader, regional scales A role for the Columbia River plume?
Does the CR plume influence salmon survival?What we know • Higher abundance of juvenile salmon in the coastal region off the CR associated with the low-salinity plume waters and frontal zones compared to the surrounding ocean waters (De Robertis et al, 2005) • Juvenile salmon do not seem to take advantage of increased zooplankton biomasses at plume fronts, possibly due to their transience or small scale (Morgan et al, 2005) • Local conditions in the environments that connect the river migration corridor to the ocean more likely determine rapid change in survival during a migration season than conditions farther away (ocean feeding areas of the gulf of Alaska or Bering Sea) (Scheuerell et al, 2009) • Survival of outmigrating juvenile salmon varies at time scales consistent with changes in the CR plume How does intraseasonal variability in salmon survival relate to variability in the physical plume environment simulated by CORIE/SATURN?
Smolt-to-adult return rates (SARs) # Adults SAR = # Juveniles PIT tagging Migration Barging Through the estuary 2-4 Years at sea Upstream migration to spawn Adult detection
The correlation analysis The CR plume:a fast-changing hydrodynamic feature • Correlation analysis between daily values of SARs and plume metrics. • Since we could only roughly estimate time of ocean entry, we explored the cross-correlations at different time lags. • Analysis performed using anomalies from the 4-year climatologies • Non-parametric method to account for autocorrelation in testing significance of cross-correlations May 1999 DB14
Steelhead Monthly PDO index 1999 1900 1920 1940 1960 1980 2000 Cross-correlation coefficient lag (days) 2002 2003 2001 1999 Poor large-scale ocean conditions Favorable large-scale ocean conditions DB14
Chinook 1999 2001 2002 2003 Poor large-scale ocean conditions Favorable large-scale ocean conditions DB14
Strengths and uncertainties • Our results were robust to the high inter-annual variability in local ocean (plume) conditions, till the regime shift in the large-scale ocean conditions occurred. • SARs are a metric that encompasses several stages in the life history of the fish and multiple years: conditions that steelhead encounter in the plume at the time of ocean entry can explain only part of their overall survival (16-40% of its variability) . • Small numbers of returning adults upon which the SARs were based made their estimate fairly imprecise, but we believe that the trends of within-season variability are correctly captured . • Alternative interpretations (e.g. local upwelling, which may affect salmon survival through bottom-up forcing of the marine food web) do not explain the differential response of the two species.
Part II: Summary of findings Introduction Research Objectives I. Seasonal and interannual variability of the CR plume II. The CR plume and salmon survival III. Salmon habitat opportunity in the CR estuary IV. Future work: residence times in the CR estuary V. Conclusions • Lagged cross-correlations suggested that steelhead benefited from the plume environment at a narrow window of time around their ocean entry. • Contribution of plume conditions to the overall variability in steelhead survival became modest when large-scale ocean conditions turned unfavorable. • Daily variability of the plume did not affect survival of Chinook salmon. • Differential response between the two species is consistent with observed and previously reported behavioral characteristics • H: Steelhead mainly use the plume to move quickly away from coastal predation and for a more direct migration to ocean habitats.
Succeeded in using the high-quality CORIE/SATURN simulations of plume dynamics to develop a biological hypothesis Q3: Can we use the high-resolution modeling capabilities of CORIE/SATURN to investigate the impact of natural variability and anthropogenic change on physical habitat opportunity for salmon in the CR estuary? Courtesy J. Burke
Part III Introduction Research Objectives I. Seasonal and interannual variability of the CR plume II. The CR plume and salmon survival III. Salmon habitat opportunity in the CR estuary IV. Future work: residence times in the CR estuary V. Conclusions Courtesy J. Burke
Physical Habitat Opportunity Long Long - - term term Long Long - - term term Long Long - - term term simulation simulation simulation simulation simulation simulation databases of databases of databases of databases of databases of databases of circulation circulation circulation circulation circulation circulation h h , u, S, T , u, S, T h h , u, S, T , u, S, T h h , u, S, T , u, S, T Habitat Opportunity = availability of habitat that, based upon physical factors, physiological constraints, and ecological interactions, salmon can access and which salmon can benefit from occupying (Bottom et al, 2005). Estuarine PHO metrics Hours of PHO per week @ each grid point • Water depth:10cm d 2m • Water velocity:v 30cm/s • Salinity:0 s 5 psu • Temperature:0 T 19 oC Sub-yearling ocean-type salmon
Physical Habitat Opportunity Long Long - - term term Long Long - - term term Long Long - - term term simulation simulation simulation simulation simulation simulation databases of databases of databases of databases of databases of databases of circulation circulation circulation circulation circulation circulation h h , u, S, T , u, S, T h h , u, S, T , u, S, T h h , u, S, T , u, S, T Habitat Opportunity = availability of habitat that, based upon physical factors, physiological constraints, and ecological interactions, salmon can access and which salmon can benefit from occupying (Bottom et al, 2005). Estuarine PHO metrics PHO accumulated per week over a specified region (hours*m2) • Water depth:10cm d 2m • Water velocity:v 30cm/s • Salinity:0 s 5 psu • Temperature:0 T 19 oC Averaged PHO within the inundated area (hours/week) Habitat opportunity Sub-yearling ocean-type salmon River flow (m3 s-1)
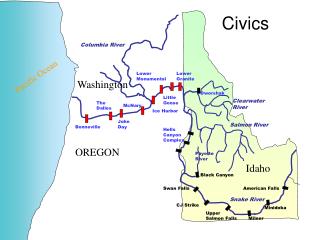
Estuarine regions Mouth Middle estuary Tidal freshwater Peripheral bays Baker Grays Youngs Cathlamet
Interannual variability and anthropogenic change Interannual variability Time series of weekly PHO climatologies and anomalies 1999-2006 simulation database Catalogue of anomaly maps Anthropogenic change Scenario 1: Predevelopment (1880) bathymetry and flow Scenario 2: Modern dikes in predevelopment scenario Scenario 3: Predevelopment flow over modern bathymetry Scenario 4: Modern (2004) flow over predevelopment bathymetry Scenario 5: Modern flow over modern bathymetry
Water depth in the modern lower estuary • Influence of tides dominates variability in shallow water (and low-velocity) habitats in the modern CR lower estuary • Differential response to neap and spring tides across lower estuary Week 42 – neap tide Week 43 – spring tide DB14
Water depth in the tidal freshwater region • Only more extreme flows have an appreciable, but still modest, impacton PHO in the modern bathymetry • Strong historical freshets brought considerable gain in shallow water habitats through access to the floodplain in the predevelopment bathymetry DB17 DB14