Download
1 / 1
10 likes | 107 Views
Using an Otolith Growth Chronology as an Archive of Environmental Change Shannon Davis-Foust and Ronald Bruch. Introduction. Methods. Results (cont.). Results (cont.).

E N D
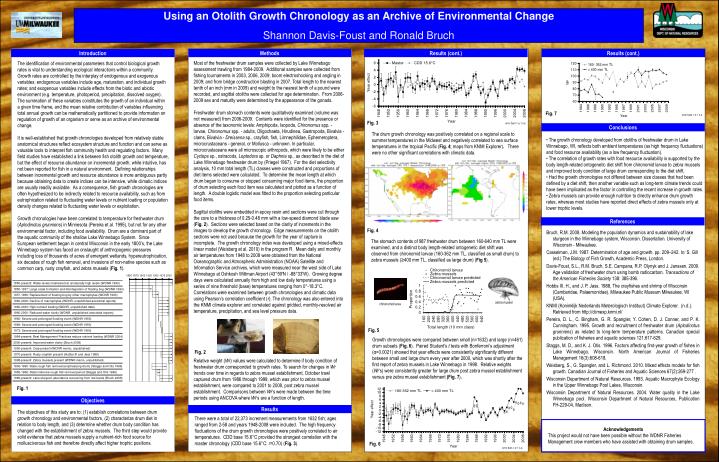
Using an Otolith Growth Chronology as an Archive of Environmental Change Shannon Davis-Foust and Ronald Bruch Introduction Methods Results (cont.) Results (cont.) Most of the freshwater drum samples were collected by Lake Winnebago assessment trawling from 1984-2009. Additional samples were collected from fishing tournaments in 2003, 2006, 2009; boom electroshocking and angling in 2009; and from bridge construction blasting in 2007. Total length to the nearest tenth of an inch (mm in 2009) and weight to the nearest tenth of a pound were recorded, and sagittal otoliths were collected for age determination. From 2006-2009 sex and maturity were determined by the appearance of the gonads. Freshwater drum stomach contents were qualitatively examined (volume was not measured) from 2006-2009. Contents were identified for the presence or absence of the taxonomic levels: Amphipoda, Isopoda, Chironomus spp. - larvae, Chironomus spp. - adults, Oligochaeta, Hirudinea, Gastropoda, Bivalvia - clams, Bivalvia - Dreissena sp., crayfish, fish, Limnephilidae, Ephemeroptera, microcrustaceans - general, or Mollusca - unknown. In particular, microcrustaceans were all microscopic arthropods, which were likely to be either Cyclops sp., ostracods, Leptodora sp. or Daphnia sp., as described in the diet of Lake Winnebago freshwater drum by (Priegel 1967). For the diet selectivity analysis, 10 mm total length (TL) classes were constructed and proportions of diet items selected were calculated. To determine the mean length at which drum began to consume or stopped consuming major food items, the proportion of drum selecting each food item was calculated and plotted as a function of length. A double logistic model was fitted to the proportion selecting particular food items. Sagittal otoliths were embedded in epoxy resin and sections were cut through the core to a thickness of 0.25-0.48 mm with a low-speed diamond blade saw (Fig. 2). Sections were selected based on the clarity of increments in the images to develop the growth chronology. Edge measurements on the otolith sections were not used because the growth for the year of capture is incomplete. The growth chronology index was developed using a mixed-effects linear model (Weisberg et al. 2010) in the program R. Mean daily and monthly air temperatures from 1948 to 2008 were obtained from the National Oceanographic and Atmospheric Administration (NOAA) Satellite and Information Service archives, which were measured near the west side of Lake Winnebago at Oshkosh Wittman Airport (43°59'N / -88°33'W). Growing degree days were calculated annually from high and low daily temperatures using a series of nine threshold (base) temperatures ranging from 0°-18.3°C. Correlations were examined between growth chronologies and climatic data using Pearson’s correlation coefficient (r). The chronology was also entered into the KNMI climate explorer and correlated against gridded, monthly-resolved air temperature, precipitation, and sea level pressure data. Relative weight(Wr) values were calculated to determine if body condition of freshwater drum corresponded to growth rates. To search for changes in Wr trendsover time in regards to zebra mussel establishment, October trawl captured drum from 1986 through 1999, which was prior to zebra mussel establishment, were compared to 2001 to 2008, post zebra mussel establishment. Comparisons between Wr’s were made between the time periods using ANCOVA where Wr’s are a function of length. The identification of environmental parameters that control biological growth rates is vital to understanding ecological interactions within a community. Growth rates are controlled by the interplay of endogenous and exogenous variables; endogenous variables include age, maturation, and individual growth rates; and exogenous variables include effects from the biotic and abiotic environment (e.g. temperature, photoperiod, precipitation, dissolved oxygen). The summation of these variables constitutes the growth of an individual within a given time frame, and the mean relative contribution of variables influencing total annual growth can be mathematically partitioned to provide information on regulation of growth of an organism or serve as an archive of environmental change. It is well-established that growth chronologies developed from relatively stable anatomical structures reflect ecosystem structure and function and can serve as valuable tools to interpret fish community health and regulating factors. Many field studies have established a link between fish otolith growth and temperature, but the effect of resource abundance on incremental growth, while intuitive, has not been reported for fish in a natural environment. Defining relationships between incremental growth and resource abundance is more ambiguous partly because obtaining data to create indices can be intensive, while climatic indices are usually readily available. As a consequence, fish growth chronologies are often hypothesized to be indirectly related to resource availability, such as from eutrophication related to fluctuating water levels or nutrient loading or population density changes related to fluctuating water levels or exploitation. Growth chronologies have been correlated to temperature for freshwater drum (Aplodinotus grunniens) in Minnesota (Pereira et al. 1995), but not for any other environmental factor, including food availability. Drum are a dominant part of the aquatic community of the shallow Lake Winnebago System. Since European settlement began in central Wisconsin in the early 1800’s, the Lake Winnebago system has faced an onslaught of anthropogenic pressures including loss of thousands of acres of emergent wetlands, hypereutrophication, six decades of rough fish removal, and invasions of non-native species such as common carp, rusty crayfish, and zebra mussels (Fig. 1). Fig. 7 error bars = ± 1 s.e. Fig. 3 error bars = ± 1 s.e. Conclusions The drum growth chronology was positively correlated on a regional scale to summer temperatures in the Midwest and negatively correlated to sea surface temperatures in the tropical Pacific (Fig. 4; maps from KNMI Explorer). There were no other significant correlations with climatic data. • The growth chronology developed from otoliths of freshwater drum in Lake Winnebago, WI, reflects both ambient temperatures (as high frequency fluctuations) and food resource availability (as a low frequency fluctuation). • The correlation of growth rates with food resource availability is supported by the body length-related ontogenetic diet shift from chironomid larvae to zebra mussels and improved body condition of large drum corresponding to the diet shift. • Had the growth chronologies not differed between size classes that had been defined by a diet shift, then another variable such as long-term climate trends could have been implicated as the factor in controlling the recent increase in growth rates. • Zebra mussels can provide enough nutrition to directly enhance drum growth rates, whereas most studies have reported direct effects of zebra mussels only at lower trophic levels. References Fig. 4 The stomach contents of 987 freshwater drum between 160-640 mm TL were examined, and a distinct body length-related ontogenetic diet shift was observed from chironomid larvae (160-362 mm TL, classified as small drum) to zebra mussels (≥400 mm TL, classified as large drum) (Fig 5). zebra mussel chironomid larva Fig. 5 Growth chronologies were compared between small (n=1632) and large (n=461) drum subsets (Fig. 6). Paired Student’s t tests with Bonferroni’s adjustment (α=0.0021) showed that year effects were consistently significantly different between small and large drum every year after 2000, which was shortly after the first report of zebra mussels in Lake Winnebago in 1998. Relative weights (Wr’s) were consistently greater for large drum post zebra mussel establishment versus pre zebra mussel establishment (Fig. 7). Fig. 2 Fig. 1 Objectives The objectives of this study are to: (1) establish correlations between drum growth chronology and environmental factors, (2) characterize drum diet in relation to body length, and (3) determine whether drum body condition has changed with the establishment of zebra mussels. The third step would provide solid evidence that zebra mussels supply a nutrient-rich food source for molluscivorous fish and therefore directly affect higher trophic positions. Results There were a total of 22,373 increment measurements from 1632 fish; ages ranged from 2-58 and years 1948-2008 were included. The high frequency fluctuations of the drum growth chronologies were positively correlated to air temperatures. CDD base 15.6°C provided the strongest correlation with the master chronology (CDD base 15.6°C: r=0.70) (Fig. 3). Acknowledgements This project would not have been possible without the WDNR Fisheries Management crew members who have assisted with obtaining drum samples. Fig. 6 error bars = ± 1 s.e.