Download

1 / 11
110 likes | 234 Views
Estimating the Impacts of Revenue Management Decisions. 4 th Annual INFORMS Revenue Management and Pricing Section Conference, June 10 – 11, 2004 Warren Lieberman and Michael Raskin Veritec Solutions (www.veritecsolutions.com). Common Performance Measures. Alternative Measurement Approaches.

E N D
Estimating the Impacts of Revenue Management Decisions 4th Annual INFORMS Revenue Management and Pricing Section Conference, June 10 – 11, 2004 Warren Lieberman and Michael Raskin Veritec Solutions (www.veritecsolutions.com)
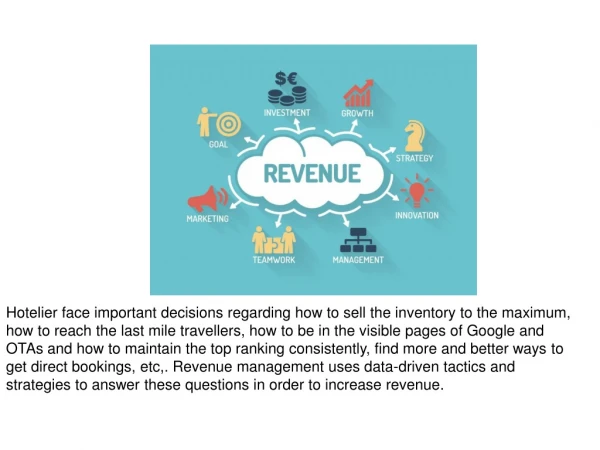
Alternative Measurement Approaches • How can we estimate the financial impacts of revenue management decisions? • Randomized experiment with control groups • Performance comparisons (e.g., pre- and post- RM) under comparable conditions • Percentage of the theoretical maximum revenue obtained • Simulation to estimate financial returns of pre-RM policies
Diminishing Empirical Content Randomized Experiment Comparable Condition Comparisons Percentage of Theoretical Maximum Simulate Impacts of Previous Policies Alternative Measurement Approaches
Back to the Basics • What is the incremental revenue we receive from RM decisions, under any economic conditions? • Supply • Demand (Market Conditions)
Comparable Challenges • How can we characterize the relevant states of supply and demand in an industry – as simply as possible? • If we can successfully define these states pre- and post-revenue management, we have a basis for estimating how much better (or worse) a business performs facing similar challenges • May no longer need to compare to previous year, competitive set, or in comparison to budget directives
Comparable Challenges: Key Indicators • Supply • Occupancy rate by unit type on the last day of the previous month • Provides an indicator of the extent to which unit availability is constrained • Demand • Average differential (expressed as a percent) between move-ins and move-outs during the previous three months • Measures the market’s response to a facility’s recent prices and product offerings
Comparable Challenges: Classification Matrix Net Occupancy Change Percentage Occupancy
Comparable Challenges: Objective • Estimate the incremental revenue obtained by the revenue management system at the same point in the season, with the same inventory, facing the same historical response to the store’s position in the market • The measure is applicable, independent of external economic conditions • The measure is limited; if you encounter a new combination in the Classification Matrix the facility is operating under previously unobserved conditions
Comparable Challenges: Summary • A fair measure because it compares performance across similar challenges • Quality of performance is distinguished from luck of circumstance • A timely measure as it can be applied at the end of any given period • Grounded in reality because it measures real incremental income • Practical because it works with readily available information • Accurate? Generalizable?
Future Directions Generalizing a ‘state change’ approach to decision making Adaptive Revenue Management