Download
1 / 39
390 likes | 481 Views
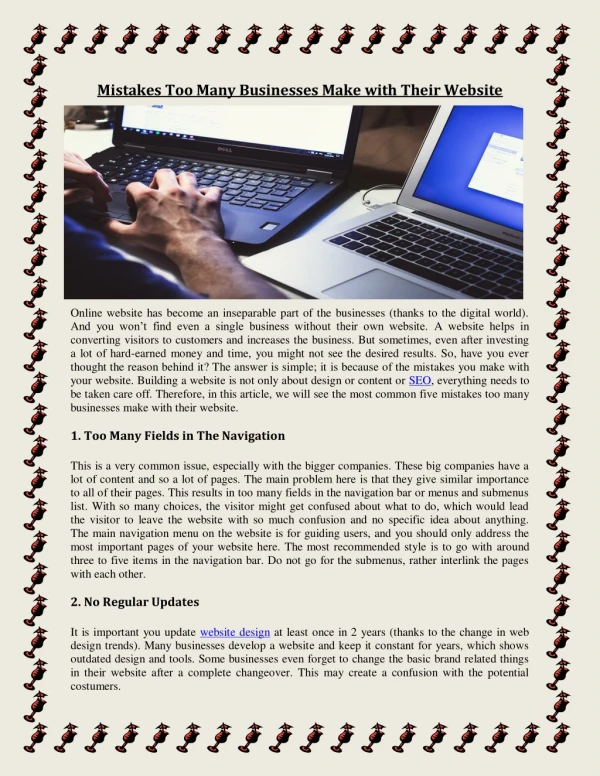
Bad Reports: Fixing Their Mistakes . Roger Noble Consultant LobsterPot Solutions. My bad report. NSW Police report Just an example, not really from the NSW Police Dept. (source data.gov.au ) Report is used to: Track incident response times Incident rates across divisions

E N D
Bad Reports: Fixing Their Mistakes Roger Noble Consultant LobsterPot Solutions
My bad report NSW Police report Just an example, not really from the NSW Police Dept. (source data.gov.au) Report is used to: • Track incident response times • Incident rates across divisions • Incident rates by offence BID-210
Bad Report Demo
First Some Theory What are we trying to communicate? • Remove non-data pixels and chartjunk • Increase data density • Use colour sparingly BID-210
Data ink and non-data ink BID-210
Chartjunk = 38.7% BID-210
Colour BID-210
Data-Ink Ratio • Ink used to present the data • Total ink used BID-210
Process for continual improvement • Identify non-data pixels • Can it be removed? • Can it be deemphasised? • Identify data pixels • Is it meaningful? • Can it be emphasised? • Repeat BID-210
Let’s fix it! Demo
Charts BID-210
Charts BID-210
Charts BID-210
Data types Dimensions • Nominal Location • Ordinal Days of week • Interval Time Measures • Additive Sales amount • Non-additive Temperature BID-210
Data types - Charting Dimensions Measures Nominal Ordinal Interval Additive Non-additive Measures Additive Non-additive BID-210
Charting – Line vs Bar Nominal BID-210
Charting – Line vs Bar Nominal BID-210
Charting – Line vs Bar Interval BID-210
Charting – Line vs Bar Interval BID-210
Let’s fix it! Demo
Tables BID-210
Tables Remove unnecessary colour and gridlines BID-210
Tables Remove gridlines and unnecessary colour BID-210
Tables Add lines and emphasis where necessary BID-210
Tables Add white space to aid with reading BID-210
Tables Add white space to aid with readingWhite space allows the eye to easily scan down columns and across rows BID-210
Indicators Be optimistic add indications only for exceptions BID-210
Indicators Be optimistic add indications only for exceptions BID-210
Let’s fix it! Demo
Problems with Pie charts Requires mental conversion from size/angle to percentage. Works well when values are close to 25% and 50% (90o and 180o) BID-210
Problems with Pie charts Distortion from perspective Slices that are closer appear larger than they are BID-210
Problems with Pie charts 32% (40) 24% (30) 20% (25) 24% (30) = Actual values can be listed in a smaller space (higher data-ink ratio) BID-210
Problems with Pie charts VS Patterns are harder to perceive BID-210
Area based charts • IncorrectSized by diameter • CorrectSized by area N 2N Area is difficult to quantify Bubbles must be sized by area not diameter (or radius or circumference) BID-210
What else is bad? Size can be perceived differently based on surroundings BID-210
Let’s fix it! Demo
Summary Identify key information Improve the data-ink ratio (remove chartjunk) Use whitespace to aid in scanning rows and columns Be optimistic with indicators Only use area based charts when accuracy isn’t important BID-210
Recommended Reading Edward Tufte Steven Few Also: William S. Cleveland, Colin Ware, Nathan Yau and Benjamin Willers BID-210
Thank you for attending this session and the 2012 PASS Summit in Seattle