Download
1 / 13
130 likes | 250 Views
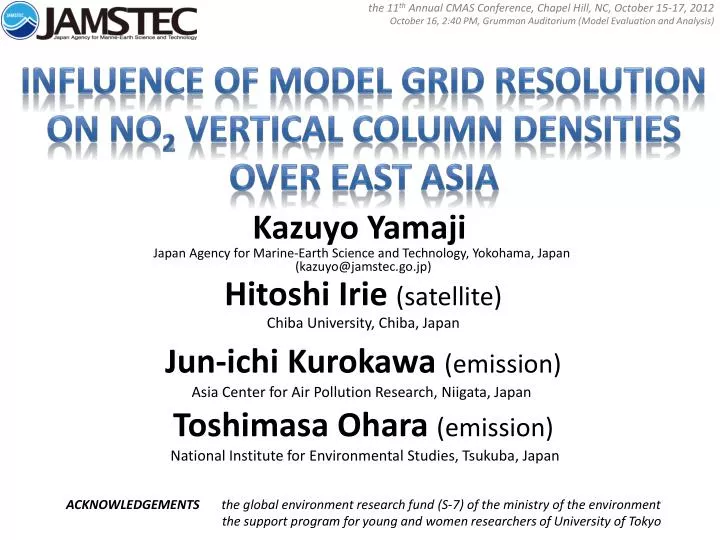
the 11 th Annual CMAS Conference, Chapel Hill, NC, October 15-17, 2012. October 16, 2:40 PM, Grumman Auditorium ( Model Evaluation and Analysis) . INFLUENCE OF MODEL GRID RESOLUTION ON NO 2 VERTICAL COLUMN DENSITIES OVER EAST ASIA. Hitoshi Irie (satellite)

E N D
the 11th Annual CMAS Conference, Chapel Hill, NC, October 15-17, 2012 October 16, 2:40 PM, Grumman Auditorium (Model Evaluation and Analysis) INFLUENCE OF MODEL GRID RESOLUTION ON NO2 VERTICAL COLUMN DENSITIES OVER EAST ASIA Hitoshi Irie(satellite) Chiba University, Chiba, Japan KazuyoYamaji Japan Agency for Marine-Earth Science and Technology, Yokohama, Japan (kazuyo@jamstec.go.jp) Jun-ichiKurokawa(emission) Asia Center for Air Pollution Research, Niigata, Japan ToshimasaOhara(emission) National Institute for Environmental Studies, Tsukuba, Japan ACKNOWLEDGEMENTS the global environment research fund (S-7) of the ministry of the environment the support program for young and women researchers of University of Tokyo
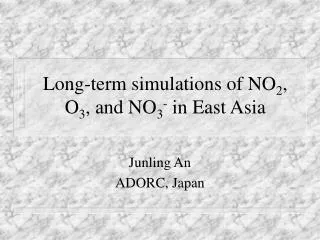
motivation CEC • East Asia, especially central eastern China(CEC), has largest emissions. • Simulated NO2VCDs • (vertical column densities) were underestimated over CEC. • e.g. by RAMS/CMAQv4.4 +REASv1.0 (Uno et al., 2007), multi-model ensemble simulations (van Noiji et al., 2006) These problems were caused by emissions?, retrievals?, or both? BUT the reasons have been still unclear • CTM’s horizontal grid resolutions may affect on simulated NO2VCDs. Finer resolutions made larger NO2VCDs over large source regions (e.g. Wild et al., 2006; Valin et al., 2011) . • In this study, we investigated influence of horizontal grid resolutions in the model system using, WRF-CMAQv4.7.1-updated REAS*, on NO2VCDs over East Asia *REAS: Regional emission inventory in Asia developed at Japan (Ohara et al., 2007)
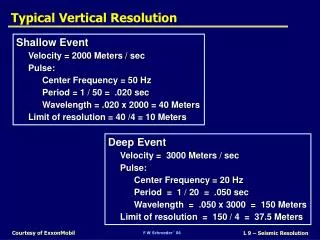
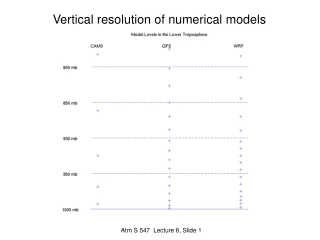
model system (WRF-CMAQ-updated REAS) • Meteorology WRF ver.3.3.1 with NCEP ds083.2 for the year 2007 [setup]Thompson(microphysics),ACM2(PBL physics),RRTM(longwave),Dudhia(shortwave) • Chemistry CMAQ ver.4.7.1 [setup] PPM(advection),ACM2_inline(vertical diffusion), SAPRC99 (gas), AERO5(aerosol) • Emissions updated REAS (monthly) with 0.25° horizontal resolution for 2007 (anthropogenic), RETRO (biomass burning), MEGANv2(biogenic emissions) • Boundary conditions outputs from global model (CHASER) for the outer domain outputs from the outer domains (nested) for the inner domains • Vertical resolution 37 layers, top=50hPa, the first mid-layer height=20 m
model system (emissions and grids information) terrain elevations NO2 emissions in June 2007
for comparisons with satellite NO2 VCDs • GOME-2 passing over the equator at9:30 LT • SCIAMACHY at10:00 LT • OMI at 13:45 LT • *These retrievals using with the same basic algorithm (DOMINO products for OMI and TM4NO2A products for SCIAMACHY and GOME-2) (Irie et al., 2012) • in this study, CMAQ NO2 VCDs • at 9:00 CST (Chinese Standard Time) • at 10:00 CST • at 14:00 CST • was used, respectively.
ResultsCMAQ (D1,80km) vs. GOME-2 and OMI JUN, morning JUN, afternoon DEC, morning DEC, afternoon • These maps compare monthly averaged NO2 VCDs from CMAQ(D1) and satellites. • CMAQv4.7.1 with updated REAS can capture well satellite NO2 VCDs even at D1 • CMAQ overestimatesover Shanghai area • In December, CMAQ underestimatesover large emission areas • On the other hand, CMAQ NO2VCDs are higher over clear area, e.g. over sea
CMAQ(D2-40km, D3-20km, and D4-10km) vs. GOME-2 and OMI JUN, morning JUN, afternoon DEC, morning DEC, afternoon • These maps compare monthly averaged NO2VCDs from CMAQ at D2, D3, and D4and satellites • CMAQ NO2VCDs are increased due to the horizontal resolution change • Finer resolutions can produce in detail NO2 VCDs distribution • Meanwhile, the finer resolutions results overestimation at some grids.
CMAQ vs. satellites using monthly averaged NO2VCDsin a 1 degree grid of all and diagnostic regions (A, B, C, and D) shown in this map. • Generally, correlations between CMAQ and satellites are reasonable • Finer resolutions produce larger NO2 VCDs at most grid • In December, CMAQ tends to overestimate over the cleaner area • In the morning in December, CMAQ tends to underestimateover the large emission areas
Biases between satellite retrievals and CMAQ NO2 VCDs diagnostic regions • The horizontal resolution change, from D1 to D2, D3, and D4 was not necessarily make improvements the biases between CMAQ NO2 VCDs and satellite retrievals • The negative biases at D1 are decreased or changed to positive biases due to theresolution change • The positive biasesare increaseddue to the resolution change, esp. comparing with GOME-2 in the morning in JUN and OMI in the afternoon in DEC
Ratios of CMAQ NOx, NOy, and NOzVCDs in D2, D3, and D4 to those of D1 *increasing from D1 *decreasingfrom D1 • NOxVCDs are increased with the resolution change from D1 to D2, D3, and D4 without linear chases in the sequence, D1-D2-D3-D4 • The largest increments in the change from Dnto Dn+1 appeared in the morning were 18% at A (from D1 to D2), 12% at B (from D1 to D2), and 13% at C (from D2 to D3) and 42% at D (from D2 to D3) • On the other hand, NOzVCDs did not have monotonic changes • These seemed to be affected by both ofin-situ non-linear chemistry andtransport.
SUMMARY • Multi-scale nested simulations (horizontal resolutions, 80, 40, 20, and 10 km) has been done to investigate influence on NO2VCDs • This model, even at the coarsest resolution, can capture well satellite NO2VCDs • NO2 (NOx) VCDsare increased withthe resolution change from D1 toD2, D3, and D4 • However, the increased NO2VCDsdue to the resolution change did not necessarily show better agreement with the satellite retrievals in this study • The largest increment in the change from D2 to D3 appears in the morning in June was 42% at region D (near Tokyo) • NOzVCDs changes due to the resolution change are more complex because of in-situ non-linear chemistry and transport
Monthly wind pattern in the first layer in Dec. 2007 D1(80km) D3(40km)