Download
1 / 27
270 likes | 294 Views
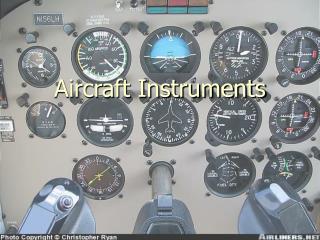
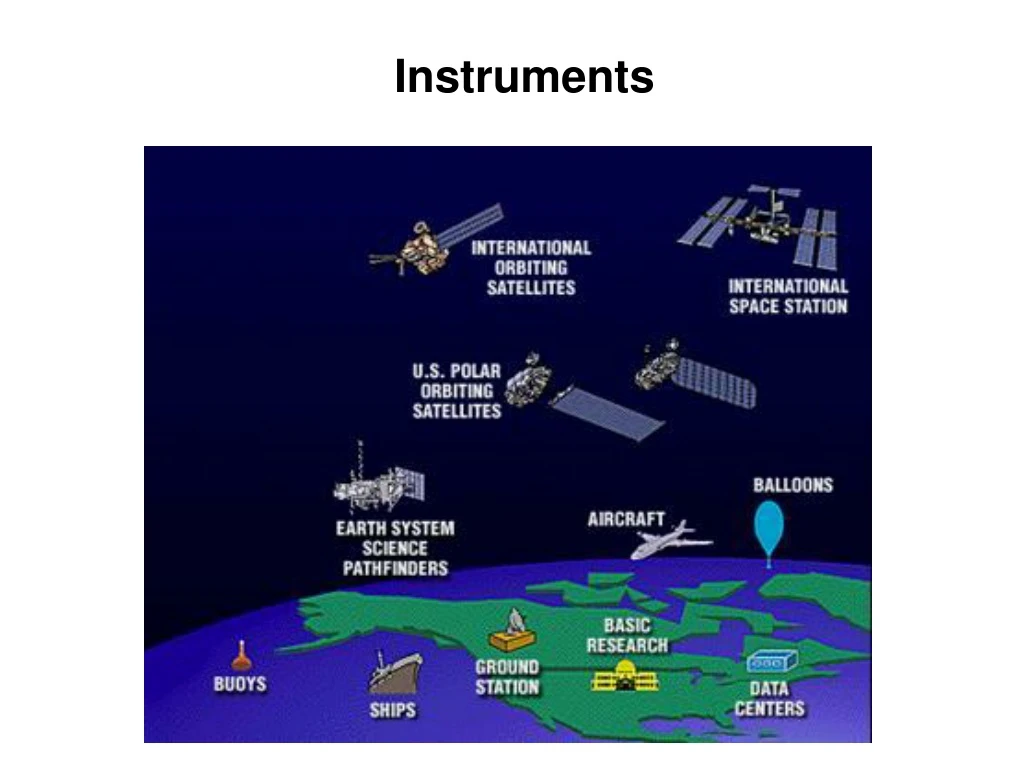
Instruments. Observations. Two major methodologies used to observe the state of the atmosphere: In situ and Remote sensing. In Situ. In situ instruments measure what is occurring in their immediate proximity. E.g., a thermometer or a wind vane. Remote sensing.

E N D
Observations Two major methodologies used to observe the state of the atmosphere: In situ and Remote sensing In Situ In situ instruments measure what is occurring in their immediate proximity. E.g., a thermometer or a wind vane. Remote sensing Remote sensing uses detectors to observe events distant from the instruments. E.g., weather radars, satellite imagers, radiometers on different platforms. Two types remote sensing: active vs. passive
Visibility (cloud base) Winds precipitation Surface Station Pressure humidity Temperature
Surface Observations Surface observations are usually reformatted to confirm to a worldwide standard and are now called METAR reports or simply METARS. These are primarily used to support aviation.
Radiosonde sounding Skew-T log-P diagram 12z
Tethersonde Large Tethersonde to Lift CO2 Sampling Tubing
Dropsonde Usually used for special field experiments (e.g., hurricane hunter)
Aircraft 12z
Aircraft 12z
Radiosondes and surface stations 12z 65 upper air soundings,866 surface stations
Observation Analysis • Analyses of observations are presented in: • Vertical profiles of significant variables • (generally referred as soundings) • Interpolated horizontal fields of primary • variables • (ex, pressure, temperature or derived vorticity, • thickness, or vertical velocity) => you have 3D analysis now
Station model on the surface At each observation on the map, detailed weather information is plotted in a predefined configurations called a stations model.
Station model on the surface Information: Sea level pressure (hPa) Pressure tendency (hPa/3h) Air temperature (F) Dew points temperature (F) Wind speed (knots, at 10-m height) Wind direction Visibility Current and previous hour weather Cloud amount Cloud height Amount of precipitation in the last 3 hours.
Station model on the surface (pressure) Pressure report 998 – 999.8 mb 113 – 1011.3 mb -03: Pressure tendency the last 3 hours, to the nearest tenth of a mb. The pressure here has fallen .3 mb the last 3 hours. (The 1st hour the pressure was steady, then fell the last two hours)
Station model on the surface (pressure) Pressure decreases with height. The pressure over a mountain top is always lower than that over a valley. In order to compare the pressure at two stations. The observed station pressures are adjusted to an estimate of what the pressure would be if the station were at sea level. The reported pressure is this pressure adjusted to mean sea level (MSL). Sea level pressure (mb): Pressure is reported as mb. However, when doing calculation, one should use Pa. 1 mb = 100 Pa =1 hPa (hectoPascal) 1 Pa = 1 Newton /m2
Station model on the surface (wind) Wind (knots): 1 m/s ~ 2 knots Southerly wind 180 degree 55 knots Northerly wind 0 degree 15 knots Easterly wind 90 degree 20 knots Westerly wind 270 degree 10 knots
564 -5 -12 Station model on the upper air map Similar to those on the surface map, but containing only temperature (C), dew point (C), height of the pressure surface (tens meters) and wind data (knots) Data at 500-mb pressure Level Temp -5 °C, dew point -12 °C,wind from south at 75 knots,height of level 5640 m