Download
1 / 11
130 likes | 295 Views
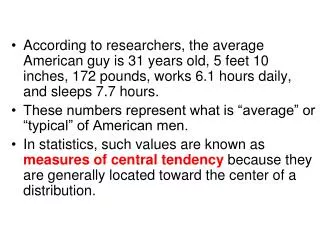
Measures of Central Tendency. By Abhi Shah, Ananth Dandibhotla, Karthik Yegnesh. Definition. A measure that tells us what the middle point in a set of data Indicates where the middle of information is located Examples are mean, median, and mode Mean is the average of a set of data.

E N D
Measures of Central Tendency • By Abhi Shah, Ananth Dandibhotla, Karthik Yegnesh
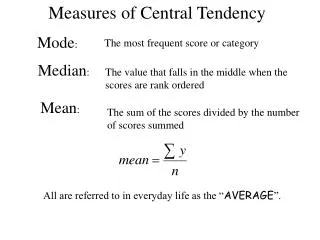
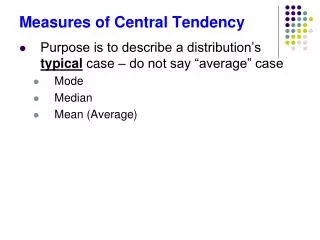
Definition • A measure that tells us what the middle point in a set of data • Indicates where the middle of information is located • Examples are mean, median, and mode • Mean is the average of a set of data. • Median is the middle value in a set of numbers in chronological order. • The mode is the number that appears the most frequently in a set of data.
Examples Median Mode -5 -4 -3 -2 -1 0 1 2 3 4 5 5 Mean [-5+(-4)+(-3)+(-2)+(-1)+0+1+2+3+4+5+5]/12= 0.416666666666666666666666667
Data Needed • A set of numerical data • You need to be able to identify a mean, median, and mode from your data.
Real World Data • Data: {2,3,3,4,4,4,4,5,5,5,5,5,5,5,5,7,7,7,7,7,9,9,9} • Mean=sum of all the elements of a set/ number of elements • Median=middle number in a set of data in numerical order • Mode= number that appears most frequently in a set of data.
Problem • If a random number is inserted in the set of data, which measure of central tendency would be least affected? • Mode
Advantages • Measures of central tendency give you a lot of information about the average of a set of data. • It expresses the most amount of data in the least amount of numbers.
Disadvantages • There is no visual approach for this type of data. • It doesn't inform you about the outliers in a set of data. • It doesn’t give you a very specific understanding of your data.
Bibliography • "Benchmark 13." Ms Skochcom RSS. N.p., n.d. Web. 19 Feb. 2013. <http://msskoch.com/unit-3-data-analysis/benchmark-13/>. • "Biostatistics for the Clinician." 1.3 Central Tendency. N.p., n.d. Web. 13 Feb. 2013. <http://www.uth.tmc.edu/uth_orgs/educ_dev/oser/L1_3.HTM>. • "Central Tendency." Wikipedia. Wikimedia Foundation, 02 July 2013. Web. 13 Feb. 2013. • "LJHutchen Fine Band Instruments." LJHutchen Fine Band Instruments. N.p., n.d. Web. 13 Feb. 2013. <http://www.ljhutchen.com/>. • "Strings Instruments, Violin, Violin Manufacturer, Violin Exporter, 4 String Violin, 5 String Violin." Strings Instruments, Violin, Violin Manufacturer, Violin Exporter, 4 String Violin, 5 String Violin. N.p., n.d. Web. 13 Feb. 2013. <http://www.calmusical.com/violin.html>.
Made by. Ananth Dandibhotla Abhi Shah Karthik Yegnesh