Download
1 / 13
550 likes | 1.63k Views
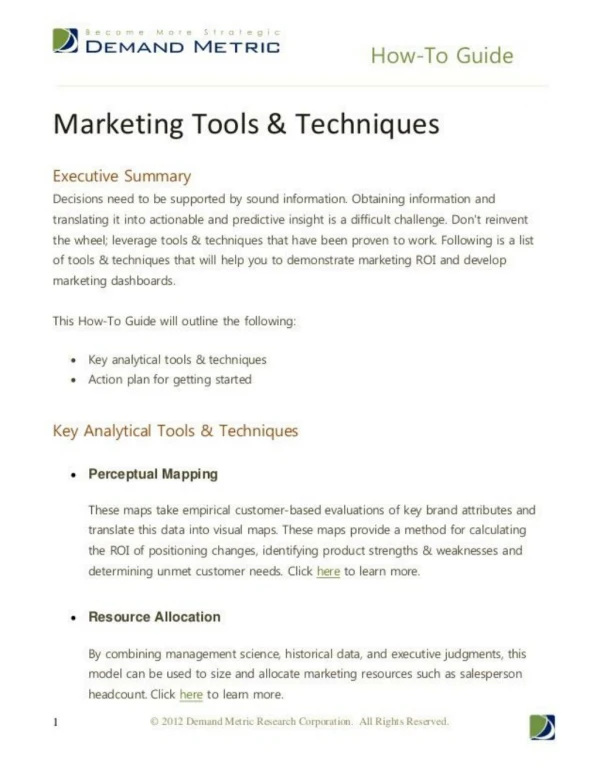
TQM Tools and Techniques. Guidelines and Principles. Who? What? Where? When? Why? How?. Data Collection Sheets.

E N D
Guidelines and Principles • Who? • What? • Where? • When? • Why? • How?
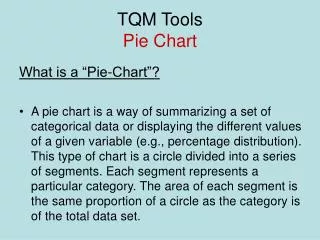
Data Collection Sheets Data collection sheets are used to gather information on performance so that problems can be identified and corrected. These sheets are designed so that the information can be easily recorded, tabulated, and analyzed.
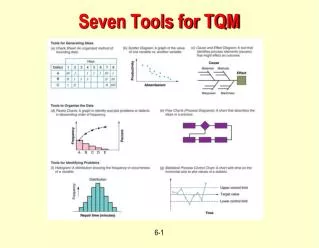
“Tool Box” The personnel must think of these tools as part of a “tool box” and, with the right tool or TQM technique, they can accurately investigate the problem and arrive at an action plan likely to resolve the problem. Pareto Chart Fish bones Scatter Diagram Flow chart …more…
Pareto Charts A Pareto Chart is a vertical bar graph that helps identify which problems are to be solved and in what order. The basic concept behind this chart is explained by the Pareto principle, which holds that 80 percent of all outcomes can be attributed to 20 percent of all causes. 100 100 90 90 80 80 70 70 60 60 The Pareto chart identifies the main problems Number of Occurrences 50 Percent of Occurrences 50 40 40 30 30 20 20 10 10 0 0 Tables Spacing Spelling Centering Underlining Punctuation Bold Lettering Incorrect Page #s Missed Paragraphs
Time Resources/People Environment Poor Visuals People Arrive Late Noisy People Not prepared Decision Maker Not Present Run Overtime Too Hot, Cold Poor SeatingArrangement Start Late Early/Late in Day Poor Problem Solving Skills No Coffee Uninvited Guests Phone in Room Postponed Discussion Wanders Incomplete Agenda Hash OverSame Problem Blocking Issues No Agenda Boss Prevents Discussion Arguments Long-Winded People Didn’t Stick to Schedule No Follow-UpAction No Organization Intimidation by Leader Communication Procedure A Cause-and-Effect Diagram the cause and effect diagram helps explain the reasons and points the way toward solutions or improvements. UnproductiveMeetings
A Scatter Diagram Showing the Relationship between Preventative Maintenance and Downtime Scatter Diagrams Hours of Downtime (in 1 Mo.) The scatter diagram illustrates the relationship between two variables. 16 14 12 10 8 6 4 2 0 2 4 6 8 10 12 14 16 Hours of Preventative Maintenance
In Answering This Question: What are the major problems? What are the causes of the major problems? What are the cause/effect relationships? Use This Tool: Pareto chart analysis Cause-and-Effect diagram Scatter diagram “Tool Box”, cont.
Customer Service Focus • Beliefs and Values • Gathering Data • Data Analysis
Cycle Time Focus Cycle time is the time needed to complete a task. This time is critical to quality improvement because of its effect on productivity.
Paring Time • One of the most common approaches to improving cycle time is to examine how the work is currently done and then identify and eliminate extraneous steps. • The procedure involves a TQM tool known as flow charting, in which all the steps in a job or process are written out in the form of a flow diagram. The diagram is examined to identify steps that can be eliminated or combined.
Employee Focus • Training • Empowerment • Involvement • Recognition • Personnel Evaluation and Development
Continuous Improvement Continuous improvement is the process of increasing the quality of goods and services through incremental gains accompanied by occasional innovation. • Increased Quality • Increased Competitiveness • Higher Profitability