Download
1 / 34
340 likes | 398 Views
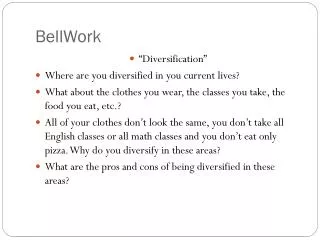
Bellwork – 12/16/13. Pick and describe two different vegetation zones that you would want to live in. Tell me why you would want to live there. A Spatial Way of Thinking. Study Guide Review. The type of map that shows population density is? Answer : A t hematic m ap.

E N D
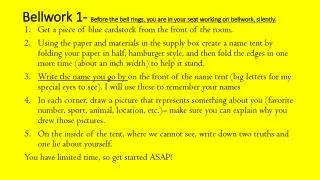
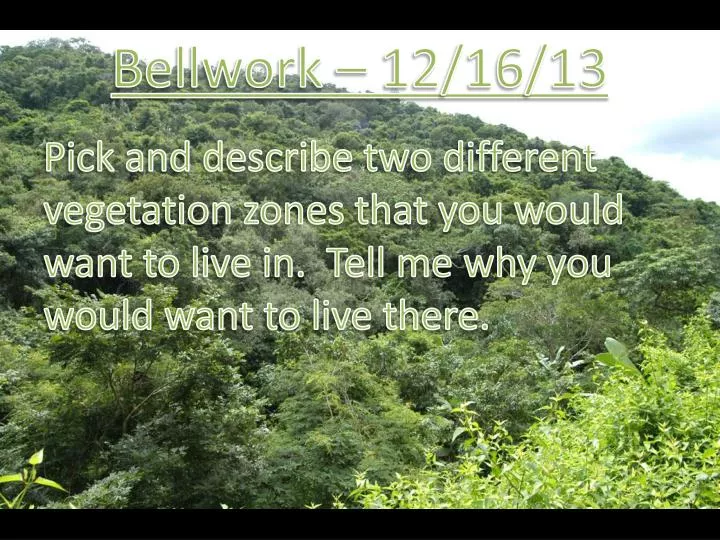
Bellwork – 12/16/13 Pick and describe two different vegetation zones that you would want to live in. Tell me why you would want to live there.
A Spatial Way of Thinking Study Guide Review
The type of map that shows population density is? Answer: A thematic map
What will you find on a map that shows physical features? Answer: Various types of landforms.
What word describes the pattern of weather over a period of time? Answer: Climate
Coal, iron, uranium, water, trees, and petroleum are examples of what? Answer: Natural Resources
What does an economic map show? Answer: How the people of that country or area make a living.
What do geographers call an area that shares similar characteristics? Answer: Geographers call an area with similar characteristics a region.
List the different thematic maps we have studied. Answer: The thematic maps we have studied are physical features map, climate map, vegetation map, population density map, economic activities map and regions map.
What kind of information is shown on the graph? Answer: This graph shows average monthly temperature and average monthly rainfall/precipitation.
9. Label the landforms and water bodies marked A – J on the diagram. A. mountain range B. volcano C. canyon D. coast E. plain F. strait G. island H. tributary I. reef J. bay
Economic Activity of Europe Answers may vary… Europe is shaped like a spade and is roughly 2500 miles from North to south and roughly 1500 miles from east to west. Europes most common natural resources are coal, precious metals, natural gas. Most economic activity takes place in the center of Europe and major cities (England, France, Germany), with some forestry in the north.