Download
1 / 53
530 likes | 670 Views
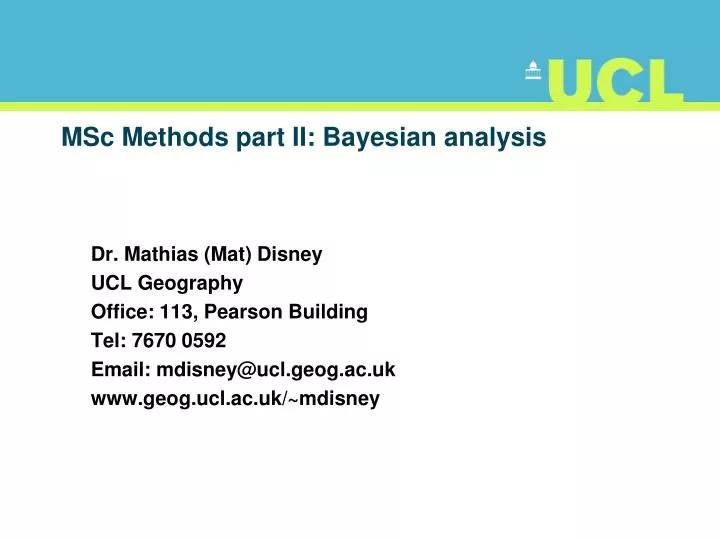
MSc Methods part II: Bayesian analysis. Dr. Mathias (Mat) Disney UCL Geography Office: 113, Pearson Building Tel: 7670 0592 Email: mdisney@ucl.geog.ac.uk www.geog.ucl.ac.uk/~mdisney. Lecture outline. Intro to Bayes ’ Theorem Science and scientific thinking

E N D
MSc Methods part II: Bayesian analysis Dr. Mathias (Mat) Disney UCL Geography Office: 113, Pearson Building Tel: 7670 0592 Email: mdisney@ucl.geog.ac.uk www.geog.ucl.ac.uk/~mdisney
Lecture outline • Intro to Bayes’ Theorem • Science and scientific thinking • Probability & Bayes Theorem – why is it important? • Frequentists v Bayesian • Background, rationale • Methods: MCMC …… • Advantages / disadvantages • Applications: • parameter estimation, uncertainty • Practical – basic Bayesian estimation
Reading and browsing Bayesian methods, data analysis • Gauch, H., 2002, Scientific Method in Practice, CUP. • Sivia, D. S., with Skilling, J. (2008) Data Analysis, 2nd ed., OUP, Oxford. Computational • Numerical Methods in C (XXXX) • Flake, W. G. (2000) Computational Beauty of Nature, MIT Press. • Gershenfeld, N. (2002) The Nature of Mathematical Modelling,, CUP. • Wainwright, J. and Mulligan, M. (2004) (eds) Environmental Modelling: Finding Simplicity in Complexity, John Wiley and Sons. Mathematical texts, inverse methods • Tarantola (XXXX) Kalman filters • Welch and Bishop • Maybeck
Reading and browsing Papers, articles, links P-values • Siegfried, T. (2010) “Odds are it’s wrong”, Science News, 107(7), http://www.sciencenews.org/view/feature/id/57091/title/Odds_Are,_Its_Wrong • Ioannidis, J. P. A. (2005) Why most published research findings are false, PLoS Medicine, 0101-0106. Bayes • Hill, R. (2004) Multiple sudden infant deaths – coincidence or beyond coincidence, Pediatric and Perinatal Epidemiology, 18, 320-326 (http://www.cse.salford.ac.uk/staff/RHill/ppe_5601.pdf) • http://betterexplained.com/articles/an-intuitive-and-short-explanation-of-bayes-theorem/ • http://yudkowsky.net/rational/bayes Error analysis • http://level1.physics.dur.ac.uk/skills/erroranalysis.php • http://instructor.physics.lsa.umich.edu/int-labs/Statistics.pdf
So how do we do science? • Carry out experiments? • Collect observations? • Test hypotheses (models)? • Generate “understanding”? • Objective knowledge?? • Induction? Deduction?
Induction and deduction • Deduction • Inference, by reasoning, from general to particular • E.g. Premises: i) every mammal has a heart; ii) every horse is a mammal. • Conclusion: Every horse has a heart. • Valid if the truth of premises guarantees truth of conclusions & false otherwise. • Conclusion is either true or false
Induction and deduction • Induction • Process of inferring general principles from observation of particular cases • E.g. Premise: every horse that has ever been observed has a heart • Conclusion: Every horse has a heart. • Conclusion goes beyond information present, even implicitly, in premises • Conclusions have a degree of strength (weak -> near certain).
Induction and deduction • Example from Gauch (2003: 219) which we will return to: • Q1: Given a fair coin (P(H) = 0.5), what is P that 100 tosses will produce 45 heads and 55 tails? • Q2: Given that 100 tosses 45 heads and 55 tails, what is the P that it is a fair coin? • Q1 is deductive: definitive answer - probability • Q2 is inductive: no definitive answer - statistics
Aside: sound argument v fallacy • If plants lack nitrogen, they become yellowish • The plants are yellowish, therefore they lack N • The plants do not lack N, so they do not become yellowish • The plants lack N, so they become yellowish • The plants are not yellowish, so they do not lack N • Affirming the antecedent: p q; p, q ✓ • Denying the consequent: p q: ~q, ~p ✓ • Affirming the consequent: p q: q, p X • Denying the antecedent: p q: ~p, ~q X
Aside: sound argument v fallacy • Fallacies can be hard to spot in longer, more detailed arguments: • Fallacies of composition; ambiguity; false dilemmas; circular reasoning; genetic fallacies (ad hominem) • Gauch (2003) notes: • For an argument to be accepted by any audience as proof, audience MUST accept premises and validity • That is: part of responsibility for rational dialogue falls to the audience • If audience data lacking and / or logic weak then valid argument may be incorrectly rejected (or vice versa)
Gauch (2006): “Seven pillars of Science” • Realism: physical world is real; • Presuppositions: world is orderly and comprehensible; • Evidence: science demands evidence; • Logic: science uses standard, settled logic to connect evidence and assumptions with conclusions; • Limits: many matters cannot usefully be examined by science; • Universality: science is public and inclusive; • Worldview: science must contribute to a meaningful worldview.
What’s this got to do with methods? • Fundamental laws of probability can be derived from statements of logic • BUT there are different ways to apply • Two key ways • Frequentist • Bayesian – after Rev. Thomas Bayes (1702-1761)
Bayes: see Gauch (2003) ch 5 • Informally, the Bayesian Q is: • “What is the probability (P) that a hypothesis (H) is true, given the data and any prior knowledge?” • Weighs different hypotheses (models) in the light of data • The frequentist Q is: • “How reliable is an inference procedure, by virtue of not rejecting a true hypothesis or accepting a false hypothesis?” • Weighs procedures (different sets of data) in the light of hypothesis
Probability? see S&S(1006) p9 • To Bayes, Laplace, Bernoulli…: • P represents a ‘degree-of-belief’ or plausibility • i.e. degree of truth, based on evidence at hand • BUT this appears to be subjective, so P was redefind (Fisher, Neyman, Pearson etc.) : • P is the ‘long-run relative frequency’ with which an event occurs, given (infinite) repeated expts. • We can measure frequencies, so P now an objective tool for dealing with random phenomena
Bayesian reasoning • Bayesian view is directly related to how we do science • Frequentist view of hypothesis testing is fundamentally flawed (Jaynes, ch 17 for eg): • To test H do it indirectly - invent null hypothesis Ho that denies H, then argue against Ho • But in practice, Ho is not (usually) a direct denial of H • H usually a disjunction of many different hypotheses, where Ho denies all of them while assuming things (eg normal distribution of errors) which H neither assumes nor denies • Jeffreys (1939, p316): “…an hypothesis that may be true is rejected because it has failed to predict observable results that have not occurred. This seems remarkable…on the face of it, the evidence might more reasonably be taken as evidence for the hypothesis, not against it. The same applies to all all the current significance tests based on P-values.”
Aside: the problem with P values • Significance testing and P-values are widespread • P-value < 0.05 tells you chance of fluke result is < 5% so we can declare this result “statistically significant at the 5% level” • BUT they tell you nothing about the effect you’re interested in (see Siegfried (2010) for eg) • 2 possible conclusions remain: • i) there is a real effect • Ii) the result is an improbable (1 in 20) fluke • P-value does not tell you which A P value is the probability of an observed (or more extreme) result arising only from chance. Credit: S. Goodman, adapted by A. Nandy http://www.sciencenews.org/view/access/id/57253/name/feat_statistics_pvalue_chart.jpg
Aside: the problem with P values • If P > 0.05 then also two conclusions: • i) there is no real effect • ii) test not capable of discriminating a weak effect • All P value of < 0.05 can say is: • There is a 5% chance of obtaining the observed (or more extreme) result if no real effect exists i.e. if the null hypothesis is correct • No more, no less – so doesn’t really get you very far….. A P value is the probability of an observed (or more extreme) result arising only from chance. Credit: S. Goodman, adapted by A. Nandy http://www.sciencenews.org/view/access/id/57253/name/feat_statistics_pvalue_chart.jpg
Bayes: see Gauch (2003) ch 5 • Prior knowledge? • What is known beyond the particular experiment at hand, which may be substantial or negligible • We all have priors: assumptions, experience, other pieces of evidence • Bayes approach explicitly requires you to assign a probability to your prior (somehow) • Bayesian view - probability as degree of belief rather than a frequency of occurrence (in the long run…)
Bayes’ Theorem • The “chief rule involved in the process of learning from experience” (Jefferys, 1983) • Formally: • P(H|D) = Posterior i.e. probability of hypothesis (model) H being true, given data D • P(D|H) = Likelihood i.e probability of data D being observed if H is true • P(H) = Prior i.e. probability of hypothesis being true before measurement of D
Bayes’ Theorem • Importance? P(H|D) appears on the left of BT • It solves the inverse (inductive) problem – probability of a hypothesis given some data • This is how we do science in practice! • We don’t have access to infinite repetitions of expts (the ‘long run frequency’ view)
Bayes’ Theorem • I is ‘background information’ as there is ‘no such thing as absolute probability’ (see S & S p 5) • P(rain today) will depend on clouds this morning, whether we saw forecast etc. etc. – I is usually left out but …. • Power of Bayes’ Theorem • Relates the quantity of interest i.e. P of H being true given D, to that which we might estimate in practice i.e. P of observing D, given H is correct
Bayes’ Theorem & marginalisation • To go from to to = we need to divide by P(D|I) • Where P(D|I) is known as the ‘Evidence’ • Normalisation constant which can be left out for parameter estimation as independent of H • But is required in model selection for e.g. where data amount may be critical
Bayes’ Theorem & marginalisation • Generally, using X for Hypothesis, and Y for Data • Where prob(X|I) is the marginalisation equation • But if Y is a proposition, how can we integrate over it?
Bayes’ Theorem & marginalisation • Suppose instead of Y and (not Y) we have a set of alternative possibilities: Y1, Y2, …. YM = {Yk} • Eg M candidates for an election, Y1 = prob. candidate 1 will win, Y2 cand. 2 will win etc. • Prob that X is true e.g. that unemployment will fall in 1 year, irrespective of who wins (Y) is • As long as • i.e. the various probabilities {Yk} are exhaustive and mutually exclusive, so that if one Yk is true, all others are false but one must be true
Bayes’ Theorem & marginalisation • As M gets larger, we approach • Eg we could consider an arbitrarily large number of propositions about the range in which my weight WMD could lie • Choose contiguous intervals and large enough range (M ∞), we will have a mutually exclusive, exhaustive set of possibilities • So Y represents parameter of interest (WMD in this case) and integrand prob(X,Y|I) is now a distribution – probability density function (pdf) • And prob. that Y lies in finite range between y1 and y2 (and X is also true) is
Eg Laplace and the mass of Saturn • Laplace (1749-1827) estimated MSaturn from orbital data • i.e. posterior prob(M|{data},I) where I is background knowledge of orbital mechanics etc. • Shaded area under posterior pdf shows degree of belief that m1 ≤ MSaturn < m2 (he was right to within < 0.7%) • How do we interpret this pdf in terms of frequencies? • Some ensemble of universes all constant other than MSaturn? Distribution of MSaturn in repeated experiments? • But data consist of orbital periods, and these multiple expts. didn’t happen Best estimate of M The posterior pdf expresses ALL our best understanding of the problem Degree of certainty of M
Example: is this a fair coin? Heads I win, tails you lose? • H? HT? HTTTTHTHHTT?? What do we mean fair? • Consider range of contiguous propositions (hypotheses) about range in which coin bias-weighting, H might lie • If H = 0, double tail; H = 1, double head; H = 0.5 is fair • E.g. 0.0 ≤ H1 < 0.01; 0.01 ≤ H2 < 0.02; 0.02 ≤ H3 < 0.03 etc.
Example: is this a fair coin? • If we assign high P to a given H (or range of Hs), relative to all others, we are confident of estimate of ‘fairness’ • If all H are equally likely, then we are ignorant • This is summarised by conditional (posterior) pdf prob(H|{data},I) • So, we need prior prob(H,I) – if we know nothing let’s use flat (uniform) prior i.e.
Example: is this a fair coin? • Now need likelihood i.e. prob({data}|H,I) • Measure of chance of obtaining {data} we have actually observed if bias-weighting H was known • Assume that each toss is independent event (part of I) • Then prob(R heads in N tosses) is given by binomial theorem i.e. • H is chance of head and there are R of them, then there must be N-R tails (chance 1-H).
Example: is this a fair coin? • How does prob(H|{data},I) evolve? TTT HT H TTTH
Gaussian prior μ = 0.5, σ = 0.05 H0 (mean) not always at peak Particularly when N small • How does prob(H|{data},I) evolve? T
Summary • The posterior pdf summarises our knowledge, based on {data} and prior • Note{data} in this case actually np.random.binomial(N, p) • Weak prior shifted easily • Stronger Gaussian prior (rightly) requires a lot more data to be convinced • See S & S for other priors…. • Bayes’ Theorem encapsulates the learning process
Summary • Takes a lot of coin tosses to estimate H to within 0.2-0.3 • If we toss 10 times and get 10 T, this might be strong evidence for bias • But if we toss 100 times and get 45H 55T, difference still 10 BUT much more uncertain • Gaussian: Although H(0.5) ~ 250000 H(0.25), 1000 tosses gets posterior to within 0.02
Reliability and uncertainty • Can we summarise PDF prob(H|{data},I) concisely (mean, error)? • Best estimate Xo of parameter X is given by condition • Also want measure of reliability (spread of pdf around Xo) • Use Taylor series expansion • Use L = loge[prob(H|{data},I)] - varies much more slowly with X • Expand about X-Xo = 0 so • First term is constant, second term linear (X-Xo) not important as we are expanding about maximum. So, ignoring higher order terms….
Reliability and uncertainty • We find • Where A is a normalisation constant. So what is this function?? • It is pdf of Gaussian (normal) distribution i.e. • Where μ, σ are maximum and width (sd) • Comparing, we see μ at Xo and • So X = Xo ±σ http://en.wikipedia.org/wiki/File:Normal_Distribution_PDF.svg
Reliability and uncertainty • From the coin example • So • Therefore • So Ho = R/N, and then • Ho tends to a constant, therefore so does Ho(1-Ho), so σ 1/√ N • So can express key properties of pdf using Ho and σ • NB largest uncertainty (σmax ) when Ho = 0.5 i.e. easier to identify highly-biased coin than to be confident it is fair EXERCISE: verify these expressions yourself
Reliability and uncertainty 95%CI • Asymmetric pdf? Ho still best estimate • But preal more likely one side of Ho than another • So what does ‘error bar’ mean then? • Confidence intervals (CI) • shortest interval enclosing X% of area under pdf, say 95% • Assuming posterior pdf normalised (total area = 1) then need X1, X2 such that • The region X1 ≤ X < X2 is the shortest 95% CI • For normalised pdf, weighted average given by • Multimodal pdf? • As pdf gets more complex, single estimates of mean not relevant • Just show posterior pdf, then you can decide…..
A more complex example: mean of Gaussian • For N data, • Given data {xk}, what is best estimate of μ and error, σ? • Likelihood? • Simple uniform prior? • Log(Posterior),L
A more complex example: mean of Gaussian • For best estimate μo • So and best estimate is simple mean i.e. • Confidence depends on σ i.e. • And so • Here μmin = -2 μmax = 15 • If we make larger? • Weighting of error for each point?
Common errors: ignored prior • After Stirzaker (1994) and Gauch (2003): • Blood test for rare disease occurring by chance in 1:100,000. Test is quite accurate: • Will tell if you have disease 95% of time i.e. p = 0.95 • BUT also gives false positive 0.5% of the time i.e. p = 0.005 • Q: if test says you have disease, what is the probability this diagnosis is correct? • 80% of health experts questioned gave the wrong answer (Gauch, 2003: 211) • Use 2-hypothesis form of Bayes’ Theorem
Common errors: ignored prior • Back to our disease test • Correct diagnosis only 1 time in 500 - 499 false +ve! • For a disease as rare as this, the false positive rate (1:200) makes test essentially useless
What went wrong? • Knowledge of general population gives prior odds diseased:healthy 1:100000 • Knowledge of +ve test gives likelihood odds 95:5 • Mistake is to base conclusion on likelihood odds • Prior odds completely dominate • 0.005 x 0.99999 ~ 0.005 >> 0.95 x 0.00001 ~1x10⁻⁶
The tragic case of Sally Clark • Two cot-deaths (SIDS), 1 year apart, aged 11 weeks and 8 weeks. Mother Sally Clark charged with double murder, tried and convicted in 1999 • Statistical evidence was misunderstood, “expert” testimony was wrong, and a fundamental logical fallacy was introduced • What happened? • We can use Bayes’ Theorem to decide between 2 hypotheses • H1 = Sally Clark committed double murder • H2 = Two children DID die of SIDS • http://betterexplained.com/articles/an-intuitive-and-short-explanation-of-bayes-theorem/ • http://yudkowsky.net/rational/bayes
The tragic case of Sally Clark • Data? We observe there are 2 dead children • We need to decide which of H1 or H2 are more plausible, given D (and prior expectations) • i.e. want ratio P(H1|D) / P(H2|D) i.e. odds of H1 being true compared to H2, GIVEN data and prior Very important - PRIOR probability i.e. previous best guess Likelihoods i.e. prob. of getting data D IF H1 is true, or if H2 is true prob. of H1 or H2 given data D
The tragic case of Sally Clark • ERROR 1: events NOT independent • P(1 child dying of SIDS)? ~ 1:1300, but for affluent non-smoking, mother > 26yrs ~ 1:8500. • Prof. Sir Roy Meadows (expert witness) • P(2 deaths)? 1:8500*8500 ~ 1:73 million. • This was KEY to her conviction & is demonstrably wrong • ~650000 births a year in UK, so at 1:73M a double cot death is a 1 in 100 year event. BUT 1 or 2 occur every year – how come?? No one checked … • NOT independent P(2nd death | 1st death) 5-10 higher i.e. 1:100 to 200, so P(H2) actually 1:1300*5/1300 ~ 1:300000
The tragic case of Sally Clark • ERROR 2:“Prosecutor’s Fallacy” • 1:300000 still VERY rare, so she’s unlikely to be innocent, right?? • Meadows “Law”: ‘one cot death is a tragedy, two cot deaths is suspicious and, until the contrary is proved, three cot deaths is murder’ • WRONG: Fallacy to mistake chance of a rare event as chance that defendant is innocent • In large samples, even rare events occur quite frequently - someone wins the lottery (1:14M) nearly every week • 650000 births a year, expect 2-3 double cot deaths….. • AND we are ignoring rarity of double murder (H1)
The tragic case of Sally Clark • ERROR 3: ignoring odds of alternative (also very rare) • Single child murder v. rare (~30 cases a year) BUT generally significant family/social problems i.e. NOT like the Clarks. • P(1 murder) ~ 30:650000 i.e. 1:21700 • Double MUCH rarer, BUT P(2nd|1st murder) ~ 200 x more likely given first, so P(H1|D) ~ (1/21700* 200/21700) ~ 1:2.4M • So, two very rare events, but double murder ~ 10 x rarer than double SIDS • So P(H1|D) / P(H2|D)? • P (murder) : P (cot death) ~ 1:10 i.e. 10 x more likely to be double SIDS • Says nothing about guilt & innocence, just relative probability
The tragic case of Sally Clark • Sally Clark acquitted in 2003 after 2nd appeal (but not on statistical fallacies) after 3 yrs in prison, died of alcohol poisoning in 2007 • Meadows “Law” redux: triple murder v triple SIDS? • In fact, P(triple murder | 2 previous) : P(triple SIDS| 2 previous) ~ ((21700 x 123) x 10) / ((1300 x 228) x 50) = 1.8:1 • So P(triple murder) > P(SIDS) but not by much • Meadows’‘Law’ should be: • ‘when three sudden deaths have occurred in the same family, statistics give no strong indication one way or the other as to whether the deaths are more or less likely to be SIDS than homicides’ From: Hill, R. (2004) Multiple sudden infant deaths – coincidence or beyond coincidence, Pediatric and Perinatal Epidemiology, 18, 320-326 (http://www.cse.salford.ac.uk/staff/RHill/ppe_5601.pdf)
Common errors: reversed conditional • After Stewart (1996) & Gauch (2003: 212): • Boy? Girl? Assume P(B) = P(G) = 0.5 and independent • For a family with 2 children, what is P that other is a girl, given that one is a girl? • 4 possible combinations, each P(0.25): BB, BG, GB, GG • Can’t be BB, and in only 1 of 3 remaining is GG possible • So P(B):P(G) now 2:1 • Using Bayes’ Theorem: X = at least 1 G, Y = GG • P(X) = ¾ and so Stewart, I. (1996) The Interrogator’s Fallacy, Sci. Am., 275(3), 172-175.