Download

1 / 30
300 likes | 311 Views
The scientific method Forming hypotheses Generating predictions Planning an investigation Variables Data transformations Constructing tables Constructing graphs Descriptive statistics Glossary. Photo: Hemera. The Scientific Method.

E N D
The scientific method • Forming hypotheses • Generating predictions • Planning an investigation • Variables • Data transformations • Constructing tables • Constructing graphs • Descriptive statistics • Glossary
Photo: Hemera The Scientific Method • Scientific knowledge is gained through a process called the scientific method. • This process involves: • Observing and measuring • Hypothesizing and predicting • Planning and executing investigations designed to test formulated predictions.
Photo: AT Making Observations • Many types of observation can be made on biological systems. They may involve: • Observation of certain behaviors in wild populations. • Physiological measurements made during previous experiments. • ‘Accidental’ results obtained when seeking answers to completely unrelated questions. • The observations may lead to the formation of questions about the system being studied. Core sample from McMurdo Sound Cardiac test
Photo: Hemera Forming a Hypothesis • Generating a hypothesis is crucial to scientific investigation. A scientific hypothesis is a possible explanation for an observation, which is capable of being tested by experimentation. • Features of a sound hypothesis: • It offers an explanation for an observation. • It refers to only one independent variable. • It is written as a definite statement and not as a question. • It is testable by experimentation. • It is based on observations and prior knowledge of the system. • It leads to predictions about the system. “Moisture level of the microhabitat influences pill-bug distribution”
Photo:AT Types of Hypotheses • Hypothesescan involve: • Manipulation: where the biological effect of a variable is investigated by manipulation of that variable, e.g. the influence of fertilizer concentration on plant growth rate. • Species preference: where species preference is investigated, e.g. woodpeckers show a preference for tree type when nesting. • Observation: where organisms are being studied in the field where conditions cannot be changed, e.g. fern abundance is influenced by the degree of canopy establishment.
H0: There is no difference between four different feeds on the growth of young rats. Photos: Hemera The Null Hypothesis • For every hypothesis, there is a corresponding null hypothesis. • The null hypothesis is a hypothesis against the prediction, i.e. a hypothesis of no difference or no effect. • A hypothesis based on observations is used to generate the null hypothesis (H0). Hypotheses are usually expressed in this form for the purposes of statistical testing. • H0 may then be rejected in favor of accepting the alternative hypothesis (HA) that is supported by the predictions. • Rejection of the hypothesis may lead to new, alternative explanations (hypotheses) for the observations. • Scientific information is generatedas scientists make discoveriesthrough testing hypotheses.
Generating Predictions 1 • An observation may generate a number of plausible hypotheses, and each hypothesis will lead to one or more predictions, which can be further tested by further investigation. For example: • Observation 1: Some caterpillar species are brightly colored and appear to be conspicuous to predators such as insectivorous birds. • Despite their beingconspicuous, predators usually avoid these brightlycolored species. • Brightly colored caterpillarsare often found in groups,rather than as solitary animals. Saddleback caterpillars, Costa Rica
Generating Predictions 2 • Observation 2: Some caterpillar species are cryptic in appearance or behavior. Their camouflage is so convincing that, when alerted to danger, they are difficult to see against their background. Such caterpillars are usually found alone. Caterpillar resembling a stem Swallowtail caterpillar
Bad to eat Generating Predictions 3 • There are several hypotheses and predictions that could be generated to account for the two previous observations: • Hypothesis 1: Bright colors signal to potential predators that the caterpillars are distasteful. • Prediction 1: Inexperienced birds will learn from a distasteful experience with an unpalatable caterpillar species and will avoid them thereafter. • Hypothesis 2: Inconspicuous caterpillars are palatable and their cryptic coloration reduces the chance that they will be discovered and eaten. • Prediction 2: Insectivorous birds will avoid preying on brightly colored caterpillars and they will prey readily on cryptically colored caterpillars if these are provided as food. Good to eat
Assumptions • In any experimental work, you will make certain assumptions about the biological system you are working with. • Assumptions are features of the system (and your experiment) that you assume to be true but do not (or cannot) test. • Possible assumptions for the previous hypotheses (and their predictions) include: • Birds and other predators have color vision • Birds and other predators can learn aboutthe palatability of their prey by tasting them.
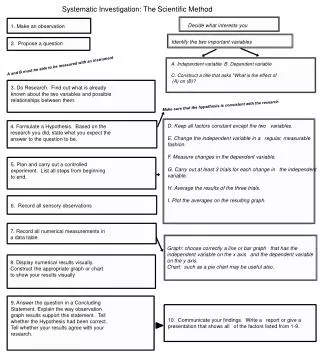
Planning An Investigation • Use a checklist or a template to construct a plan as outlined below: • Preliminary • Aim and hypothesis are based on observation. • Study is feasible and the chosen organism issuitable for study. • Assumptions and variables • Assumptions and variables have been identifiedand controls established. • Preliminary treatments or trials have been considered. • Data collection • Any necessary changes have been madeto the initial plan. • A results table accommodates all raw data. • Data can be analyzed appropriately. Observation is the starting point for any investigation
Variables • A variable is any characteristic or property able to take any one of a range of values. Investigations often look at the effect of changing one variable on another (the biological response variable). • It is important to identify all variables in an investigation: independent, dependent, and controlled. Note that there may be nuisance factors of which you are unaware. • In all fair tests, only one variable (the independent variable) ischanged by the investigator. A terrarium experiment using a PASCO datalogger to record data
Dependent variable Controlled variables • Factors that are kept the same or controlled during the investigation. • List these in the method as appropriate to your investigation. • Measured during the investigation. • Recorded on the Y axis of the graph. Independent variable Dependent variable • Set by the investigator.Recorded on the X axis of the graph Independent variable Identifying Variables • All variables (independent,dependent, andcontrolled) must be identified in an investigation.
Qualitative Non-numerical and descriptive, e.g. sex, color, presence or absence of a feature, viability (dead/alive). Continuous e.g. Height of children in a family (1.5 m, 1.3 m, 0.8 m) Discontinuous e.g. Number of children in a family (3, 0, 4) Ranked Provide data that can be ranked on a scale that represents an order, e.g. abundance (very abundant, common, rare); color (dark, medium, pale). Quantitative Characteristics for which measurements or counts can be made, e.g. height, weight, number. Types of Variables e.g. Sex of children in a family (male, female) e.g. Birth order in a family (1, 2, 3) Variables and Data • Data are the collected values for monitored or measured variables. • Like their corresponding variables, data may be qualitative, ranked, or quantitative(or numerical).
Accuracy and Precision • Accuracy refers to how close a measured value is to its true value. Simply put, it is the correctness of the measurement. • Precision refers to the closeness of repeated measurements to each other i.e. the ability to be exact. Inaccurate and imprecise Precise but inaccurate Accurate but imprecise Accurate and precise
Transformations Photosynthetic rate in Lemna at different light intensities • Data are often transformed (changed) as a first step in the analysis of results. • Transforming data can make them more useful by helping to highlight trends and make important features more obvious. • Basic transformations include frequencies, rates, percentages, or relative values. • Calculation of a rate is a commonly performed data transformation and is appropriate when studying the growth of an organism (or population). • Biological investigations often compare the ratesof events in different situations, as shown in the example of photosynthetic rate in Lemna (duckweed) leaves right.
Tables • Tables organize data in a systematic way. • Tables are used to record data during an investigation. They provide an accurate record of numerical values and allow organization of data in a way that makes relationships and trends more apparent. An example of a well constructed table is shown below: Table 1: Length and growth of the third internode of bean plants receiving three different hormone treatments.
Independent variable in left column Control values should be placed at the beginning of the table Tables should have an accurate, descriptive title. Number tables consecutively through the report Heading and subheadings identify each data and show units of measurement Each row should show a different experimental treatment, organism, sampling site etc. Columns that need to be compared should be placed alongside each other Organize the columns so that each category of like numbers or attributes is listed vertically Show values only to the level of significance allowable by your measuring technique Constructing Tables • Some basic guidelines for constructing tables are given below. Table 1: Length and growth of the third internode of bean plants receiving three different hormone treatments.
Graphs • Graphs (sometimes called charts) are useful for providing a visual image of trends in the data in a minimum of space. Fig. 1: Yield of two bacterial strains at different antibiotic levels. Vertical bars show standard errors (n = 6) Yield (absorbance at 550 nm) Antibiotic (g m–3)
A break in an axis allows economical use of space if there are no data in the “broken” area. A floating axis (where zero points do not meet) allows data points to be plotted away from the vertical axis. Each axis should have an appropriate scale. Decide on the scale by finding the maximum and minimum values for each variable. Fig. 1: Yield of two bacterial strains at different antibiotic levels. Vertical bars show standard errors (n = 6) Plot points accurately. Different responses can be distinguished using different symbols, lines or bar colors. The dependent variable e.g. biological response, is plotted on the vertical (y) axis Graphs (called figures) should have a concise, explanatory title. They should be numbered consecutively in your report Label both axes (provide SI units of measurement if necessary) The spread of the data around the plotted mean value can be shown on the graph. Such measures include standard deviation and range. The values are plotted as error bars and give an indication of the reliability of the mean value. A key identifies symbols. This information sometimes appears in the title. Yield (absorbance at 550 nm) Antibiotic (g m–3) Constructing Graphs • Some basic guidelines for constructing graphs are shown below: The independent variable, e.g. treatment, is on the horizontal (x) axis
Mean carapace width of these beetles is 4 mm. But what is the variation in this this statistic in the population? Descriptive Statistics • Descriptive statistics, such as mean, median, and mode, can be used to summarize data and provide the basis for statistical analysis. • Each of these statistics is appropriate to certain types of data or distributions, e.g. a mean is not appropriate for data with a skewed distribution. • Standard deviation and standard error are statistics used to quantify the amount of spread in the data and evaluate the reliability of estimates of the true (population) mean (µ).
Central Tendency and Spread • In a set of data values, it is useful to know the value around which most of the data are grouped, i.e. the center value or central tendency and how the data are distributed (the spread). • Measures of central tendency include mean, median, and mode. Is this fish catch normally distributed? Brendan Hicks
Frequency Distributions Bimodal distribution Frequency • Variability in continuous data is often displayed as a frequency distribution. • A frequency plot will indicate whether the data have a normaldistribution, or whether the data is skewed or bimodal. • The shape of the distribution will determine which statistic (mean, median, or mode) best describes the central tendency of the sample data. Skewed distribution Frequency Normal distribution Frequency Weight (g)
2.5% 2.5% x-2s x-1s x x+1s x+2s Measuring Spread • Standard deviation (s) is a frequently used measure of the variability (spread or dispersion) in a set of data. Two different sets of data can have the same mean and range, yet the distribution of data within the range can be quite different. • In a normally distributed set of data: • 68% of all data values will lie within one standard deviation of the mean; • 95% of all data values will lie within two standard deviations of the mean. • The variance (s 2) is another such measure of dispersion but the standard deviation is usually the preferred of these two measures. Normal distribution Frequency 68% 95% Size class
mean trendline Confidence limits are given by x̅̅ ± 95%CI large 95% CI small 95% CI The Reliability of the Mean • The reliabilityof thesample mean (x̅) as an estimate of the true population mean can be indicated by the calculation of the standard error of the mean (standard error or SE). The standard error then allows the calculation of the 95% confidence interval (95% CI) which can be plotted as error bars. • The 95% confidence limits are givenby the value of the mean ± 95%CI. • A 95% confidence limit (i.e. P = 0.05) tells you that, on average, 95 times out of 100, the true population mean will fall within these limits. • For example, if we calculated the mean number of spots on 10 ladybirds, the 95%CI will tell us how reliable that statistic is as an indicator of the mean number of carapace spots in the whole population.
Photo: AT Statistical Tests • Different statistical tests are appropriate for different types of data. The type of data collected will determine how/if it can be tested. • The null hypothesis of no differenceor no effect can be tested statistically and may then be rejected in favor of accepting the alternative hypothesis that is supported by the predictions. • Statistical tests may test for: • a difference between treatments or groups • a trend (or relationship) in the data, for example, correlation and regression. The weight change of shore crabs at different salinities can be analyzed using a regression.
Use a sharp pencil and simple narrow lines. If you need to represent depth use stippling (dotting). Do not use shading, it can smudge and obscure detail. Drawings should include a title. Biological Drawings Copepod. Single eye • Drawings record what a specimen looks likes and gives you the opportunity to record its important features. • A biological drawing should include as much detail as you need to distinguish different structures, but avoid unnecessary details which may be confusing. Trunk Make sure you drawing is placed on the page to give sufficient room for labels. Egg sac Thorax Labeling lines should be straight and should not cross over other label lines. Your drawing should include a scale or magnification to indicate the size of your subject. 0.2 mm