Download
1 / 51
510 likes | 642 Views
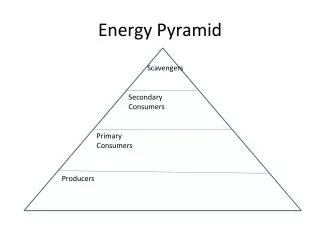
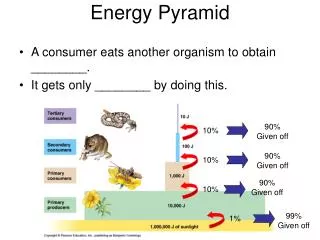
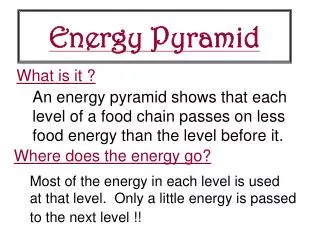
Energy and Biomass Pyramid (together). Represents amount of energy available at each level as well as amount of living tissue—both decrease with each increasing trophic level. V. Ecological Interactions between organisms

E N D
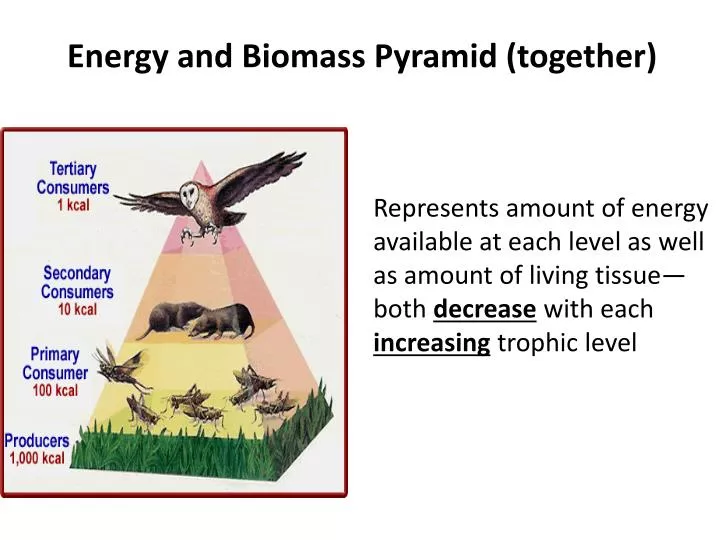
Energy and Biomass Pyramid (together) Represents amount of energy available at each level as well as amount of living tissue—both decrease with each increasingtrophic level
V. Ecological Interactions between organisms • Competition—when two organisms of the same or different species attempt to use an ecological resource in the same place at the same time. • Ex: food, water, shelter
Monkeys compete with each other and other animals for food. Rams compete with each other for mates.
Until Americans introduced gray squirrels into parts of England in the early 20th century, red squirrels had been the only species of squirrel in the country. The gray squirrels were larger and bred faster and successfully competed for resources. Within a couple years of overlap in an area, the red squirrels disappeared.
B. Niche—the ecological niche involves both the place where an organism lives and the roles that an organism has in its habitat. Example: The ecological niche of a sunflower growing in the backyard includes absorbing light, water and nutrients (for photosynthesis), providing shelter and food for other organisms (e.g. bees, ants, etc.), and giving off oxygen into the atmosphere.
The ecological niche of an organism depends not only on where it lives but also on what it does. By analogy, it may be said that the habitat is the organism’s “address”, and the niche is its “profession”, biologically speaking. “Address”—Soil, Ground, etc. Worm’s Niche “Profession”– Mix-up soil
C. Predation—one organism captures and feeds on another organism • 1. Predator—one that does the killing • 2. Prey—one that is the food
D. Symbiosis—any relationship in which two species live closely together 1. Mutualism—both species benefit (WIN-WIN) a. Ex: insects and flowers Can you think of any other examples that we’ve talked about in class?
2. Commensalism—one member of the association benefits and the other is neither helped nor harmed. (WIN-0) Example: barnacles on a whale
The Remora fish attaches to the shark and gets a free ride. Commensalism Birds build nests in trees.
3. Parasitism—one organisms lives on or inside another organism (host) and harms it. The parasite obtains all or part of its nutritional needs from the host. (WIN-LOSE) Example: fleas on a dog
Wasp eggs on back of caterpillar. Parasitism Sea lampreys feed on fluids of other fish. Mosquito biting a human.
Mutualism, Commensalism or Parasitism?? Parasitism Mutualism
Density and Distribution of Populations • Population Density - Number of individuals per unit area or volume. • Population Distribution - Pattern of dispersal of individuals within the area of interest.
Characteristics of Populations • They tend to grow • Intrinsic Rate of Natural Increase (r)
Population Growth Models • Exponential Growth • Biotic Potential • Environmental Resistance
Logistic Growth • Logistic growth—indicated by an S-shaped curve • Difference between logistic and exponential due to environmental resistance
Carrying Capacity • Carrying Capacity is the maximum number of individuals of a given species the environment can support. • The closer the population to the carrying capacity, the greater the environmental resistance. • Biotic potential is having full effect and birthrate is a maximum during exponential growth.
Mortality Patterns • Cohort --- all the members of a population born at the same time. • Survivorship---the probability of newborn individuals of a cohort surviving to particular ages. • Illustrated by Survivorship Curves
Age Distributions • What proportion of population is in each cohort? • Age Structure Diagrams
Regulation of Population Size • Density - Dependent Factors • Density - Independent Factors
Factors That Affect Population Size Density Dependent Factors • 1. Competition • Intraspecific • Interspecific Predation Parasitism 4. Disease
Factors That Affect Population Size Density Independent Factors Abiotic factors 2. Unpredictable, catastrophic events
Life History Patterns • r - Strategists (Opportunistic) • Remember r=reproduction
Life History Patterns • k - Strategists (Equilibrium) • Remember k=Karrying kapacity
Human Population Growth • Human population has had an exponential growth pattern. • Doubling time currently estimated at 53 years. • Population Size • 1800 1 Billion • 1930 2 Billion • 1960 3 Billion • 2000 6 Billion
Country Development • More-Developed Countries (MDCs) GR=0.1% • Less-Developed Countries (LDCs) GR= 1.6% • LDC population expected to increase from 5-8b by 2050
Age Distributions • Age Structure Diagrams divide populations into three age groups. • Pre-Reproductive • Reproductive • Post-Reproductive
The Demographic Transition • Stage I: high birthrates and death rates • Stage II: continued high birthrates, declining death rates • Stage III: falling birthrates and death rates, eventually stabilizing
Age Distribution of the World’s Population Population Structures by Age and Sex, 2005 Millions Less Developed Regions More Developed Regions Age 80+ 75-79 70-74 65-69 60-64 55-59 50-54 45-49 40-44 35-39 30-34 25-29 20-24 17-19 10-16 5-9 0-4 Male Female Male Female Source: United Nations, World Population Prospects: The 2002 Revision (medium scenario), 2003.
Environmental Impact • Measured in terms of: • Population Size • Resource Consumption Per Capita • Resultant Pollution
Review • Scope of Ecology • Population Density and Distribution • Population Growth Models • Survivorship Curves • Age Distributions • Regulation of Population Size • Life History Patterns • Human Population Growth • Environmental Impact