Download
1 / 31
310 likes | 399 Views
International Comparisons with a Nation At Risk.

E N D
International Comparisons with a Nation At Risk
"If an unfriendly foreign power had attempted to impose on America the mediocre eduational performance that exists today, we might well have viewed it as an act of war. As it stands, we have allowed this to happen to ourselves. . . We have, in effect, been committing an act of unthinking, unilateral educational disarmament." (Gardiner et all 1983, p. 5)
The Committee In August 1981, the U.S. Secretary of Education, Terrel (Ted) H. Bell, created the National Commission on Excellence in Education, with the mandate "to present a report on the quality of education in America."
Who? • The Commission consisted of at a minimum of 12 and maximum of 19 members from different professions knowledgeable about different educational programs. • The members were appointed by the secretary. From among the members, the Secretary appointed the Chairman David Gardiner. • Included on the committee were educational professionals as well as buiness employers.
Stated Purpose • The charter required the commission to assess the "quality of teaching and learning" at the primary, secondary, and postsecondary levels, in both the public and private spheres; and to compare "American schools and colleges with those of other advanced nations." • The Commission had a limited time span of 18 months. From August 1981 to the time the report was issued in April 1983.
Costs: • Compensation per member was $100 day plus travel expenses for meetings. • Estimate of the direct cost for operating the Commission for member compensation and travel, excluding staff support, was $332,000. • Estimate of direct annual costs for administrative support, staff and staff per diem and travel expenses is $453,000. • The National Institute of Education provided additional administrative and research assistance to the Commission.
What Authority? The Commission is governed by the provisions of Part D of the General Education Provisions Act P. L. 90-247, The Elementary and Secondary Education Act Amendments of 1968.
Methods 1981-1983 Public Hearings, Symposium and Panel Discussions and take place in Colorado, Massachusetts, Rhode Island, Illinois, Pennslyvania, California, Texas. In addition the Commission meets in Washington, D.C. 8 times.
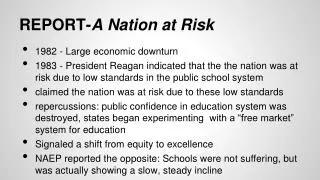
Major Findings: • "Average achievement of high school students on most standardized tests is now lower than 26 years ago when Sputnik was launched" (Gardner 1983, p. ) • According to the Library of Congress(1985) : " The Congressional Research Service receives numerous requests for standardized educational test scores of specific States and local communities. With one exception, we are unable to provide such data. Standardized test scores typically are compiled only by the schools or school districts that administer the exams; in general, they can be obtained only by contacting school officials in each locality."
There is no evidence in any appendix or any of the reports where this information was obtained, whether it is fact or specifically which 'standardized test scores' they meant. • At the time of this report(1983) " only the Iowa Tests of Basic Skills and Iowa Tests of Educational Development provided such trends. "(
"International comparisons of student achievement, completed a decade ago, reveal that on 19 academic tests American students were never first or second and, in comparison with other industrialized nations, were last seven times. " "Gardner et al, 1983 p. ) • The study they are referring to is the First International Science study which compared 19 different countries and was completed in 1973 and focussed on biology, chemistry and physics with 10 year olds, middle school students and year 12. • The study was concerned with achievement in science and also with attitudes, methods of teaching, the development of practical skills, and an understanding of the nature of science. The data were collected in 1970–1971.
Problems with the study included: 1. Inconsistent reporting of numbers. 2. Questions were submitted by different countries, some countries submitting the majority of content. 3. Students sampled were arbitrarily grouped by age category which did not correspond to school year/content/field of study. i.e. in some countries students start school younger than others and the science may be studied at different levels. To look at all 10 year olds may include student who have never studied science at one extreme and students who have gone far beyond basic science curriculum. The curriculum tested covered typical 4th grade content… Since students leave public school at different points, selecting the "final year" of secondary school mixed different levels. 4. Some students told "not to guess", answers illegible, incomplete, tabulating errors
TIMSS • After the First International Science Study, the Second was issued in 1984, then the Third International Math and Science Study was conducted and reported in 1995, and again in 1999, and now called Trends in International Math and Science Study • Conducted by the IEA-International Association for the Evaluation of Educational Achievement, funded by the NSF and NCES • In 2003 grades 4 and 8 were tested.
Comparing the results from 4th grade are comparing different levels of content in both mathematics and science. All but 3 countries had "National Curriculum", U.S., Belgium and Australia are exceptions. Only 13 of the more than 50 countries differentiate instruction for special groups of students. (U.S. does)
Examining the topics taught find that the U.S. teaches a higher level content at lower grades than other countries. i.e. Geometry Similar Triangles taught in 4th grade to 79% of the students. Taught only to the same grade in Italy, other countries taught in grades up to secondary grades.
Gerald Bracey Don't let yourself get snookered by education statistics! The first principle is to question statistics that, while accurate enough, do not tell the whole story. For example, the 1983 federal government report, A Nation at Risk, is a veritable treasury of slanted, spun, and distorted statistics.
Quoting from A Nation At Risk ""There was a steady decline in science achievement scores of U.S. 17-year-olds as measured by national assessments...."This was true, but why did the report highlight only science and only 17-year-olds? Well, it seems that there was no "steady decline" in science for 9- and 13-year-olds, the other ages tested at the time. There also was no hint of decline for any of the three age groups for reading or math." (p. 45) The commission had trend lines for 3 different subjects for 3 different age groups, but they picked the ones that supported their claims.
Gerald Bracey The first time "everything changed": The 17th bracey report on the condition of public education. Bracey " Twenty years ago, or even 10, “falling behind” would have been defined in terms of test scores. But the TIMSS data from 1995, 1999, and 2005 showed American students making larger gains than students in many other nations, so test scores are no longer available as evidence for that charge. " (p. 126)
Gerald Bracey "Bestor, a history professor, claimed that “we are less educated than 50 years ago.” He claimed that the percentage of high school students taking some science had dropped from 84% in 1900 to 54% in 1950; mathtaking had plummeted from 86% to 55%. For a historian, this was a remarkable statistical lapse. Apparently, Bestor was not aware that in 1900, the high school graduation rate was 7%. It would hardly be surprising that students in such an elite group would be studying mathematics. By 1950, the graduation rate had moved past 60%." (p. 122)
Gerald Bracey The 16th bracey report on the condition of public education. "At the eighth-grade level, among the 22 nations with scores from both 1995 and 2003, 13 showed declines in math. Some are large and hard to explain: Sweden, -41; Norway, -37; and Bulgaria, a whopping -51. Of the nine gainers, only three — Latvia (17), Lithuania (30), and Hong Kong (17) — had larger gains than the U.S. (12 points). Collectively, these three nations contain 12.8 million people — almost as many people as metropolitan Los Angeles." (p. 156)
Gerald Bracey April foolishness: The 20th anniversary of "A nation at risk." in his memoir, The Thirteenth Man, Ted Bell who, as Secretary of Education, brought together the commission that produced "Risk," It was not to objectively examine the condition of American education, but to document the terrible things that Bell had heard about schools. Bracey quotes Bell as looking for the "'Sputnik-type occurrence' that would dramatize all the 'constant complaints about education and its effectiveness' that he kept hearing."
"Over half the population of gifted students do not match their tested ability with comparable achievement in school" (Gardner et al, 1983 p. 8). Bracey challenged the qualifier 'comparable achievement'. Where does this mean? No definitions are given for any of these statements. A puzzle.
Sandia National Laboratories in Albuquerque, • Contained 78 pages of tables and graphs and another 78 pages of explanations • Finding: Public education has problems but no systemwide crisis • Sec. of Energy James Watson "Report Dead Wrong" • Dep. Sec. of Education Kearns forbid engineers from leaving or discussing the report "You bury this, or we'll bury you.
"In January 1996, for instance, a full-page ad in the New York Times showed the rankings of 14-year-olds in math. Out of 15 countries, the U.S. ranked 14th. "If this were a ranking in Olympic Hockey, we would be outraged," said the large-type ad." (p. 165) The ad credited the AdCouncil as its sponsor, but it was paid for by American Federation of teachers, U.S. Department of Education, etc.
Gerald Holton has commented that the purpose behind the report in 1983 was to dismantle the Department of Education and push the political agenda of Reagan and his advisors. The final report was not in line with the expressed criteria given to the committee members, and clearly disappointed the President.
The Rest of the Story • Gerald Holton, Professor Harvard University and member of the commission "We met with President Reagan at the White House, who at first was jovial, charming, and full of funny stories, but then turned serious when he gave us our marching orders. He told us that our report should focus on five fundamental points that would bring excellence to education: • Bring God back into the classroom. • Encourage tuition tax credits for families using private schools. • Support vouchers. • Leave the primary responsibility for education to parents. • And please abolish that abomination, the Department of Education. Or, at least, don't ask to waste more federal money on education -- "we have put in more only to wind up with less."
References Congressional Research Service (1985) Standardized Test Scores. Library of Congress document IP0294S Eckstein, M. A., & And Others. (1982). A comparative review of curriculum: Mathematics and international studies in the secondary schools of five countries Bracey, G. W. (2001). The 11th bracey report on the condition of public education. Phi Delta Kappan, 83(2), 157-168. Bracey, G. W. (2001). Getting dumber in school? Principal Leadership, 1(7), 58-63. Bracey, G. W. (2000). "Diverging" american and japanese science scores. Phi Delta Kappan, 81(10), 791-792. Bracey, G. W. (2000). The TIMSS "final year" study and report: A critique. Educational Researcher, 29(4), 4-10. Bracey, G. W. (1998). Tinkering with TIMSS. Phi Delta Kappan, 80(1), 32-36.
Bracey, G. W. (1998). TIMSS, rhymes with "dims," as in "witted.". Phi Delta Kappan, 79(9), 686-687. Bracey, G. W. (1998). TIMSS: The message and the myths. Principal, 77(3), 18-22. Bracey, G. W. (1997). Accuracy as a frill. Phi Delta Kappan, 78(10), 801-802. Bracey, G. W. (1997). More on TIMSS. Phi Delta Kappan, 78(8), 656-657. Jakwerth, P. (1999). TIMSS performance assessment results: United states. Studies in Educational Evaluation, 25(3), 277-281. Gardner, D. P., & And Others. (1983). A nation at risk: The imperative for educational reform. an open letter to the american people. A report to the nation and the secretary of educationSuperintendent of Documents, Government Printing Office, Washington, DC 20402 (Stock No. 065-000-00177-2, $4.50).
Reply to 'A nation at risk:' report to the CEC ad hoc committee to study and respond to the 1983 report of the national commission on excellence in education.(1984). Exceptional Children, 50(6), 484-494. Bracey, G. W. (2007). The first time "everything changed": The 17th bracey report on the condition of public education. Phi Delta Kappan, 89(2), 119-136. Bracey, G. W. (2006). The 16th bracey report on the condition of public education. Phi Delta Kappan, 88(2), 151-166. Bracey, G. W. (2006). Don't let yourself get snookered by education statistics! Education Digest: Essential Readings Condensed for Quick Review, 72(1), 44-47. Bracey, G. W. (2002). Another nation at risk? Phi Delta Kappan, 84(3), 245-247. Bracey, G. W. (2002). April foolishness: The 20th anniversary of "A nation at risk.". Phi Delta Kappan, 84(8), 616-621.