Download
1 / 16
160 likes | 422 Views
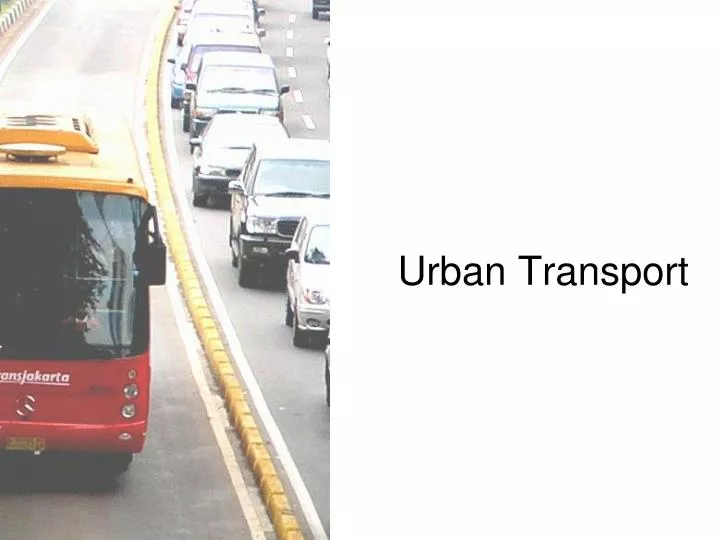
Urban Transport. Outline. Issues in urban transports Road-based urban transport Mass Rapid Transit (MRT) Urban transport Institution Summary. 1) Issues in urban transports. Decline in Public transport patronage Forecast versus actual Ridership (rail and bus) Capital outlays

E N D
Outline • Issues in urban transports • Road-based urban transport • Mass Rapid Transit (MRT) • Urban transport Institution • Summary
1) Issues in urban transports • Decline in Public transport patronage • Forecast versus actual • Ridership (rail and bus) • Capital outlays • Error in choice technology • Mistakes in public policy
Facts • Declines in transit passengers associated with the increase in car ownership • Too optimistic • Transit ridership is far below forecasting • Operating costs are higher than expected • Higher capital outlays • Larger government subsidy than planned
Is there any room to intervene? Decline in rail transits & Larger subsidy Mistakes in public policy & Errors by transit operators in their choice of technology Increase in car ownership Changes in technologies & Rising incomes
Who and where? • Serve commuters in large metro areas • Seven largest metro accounted for 69% transit trips (USA, 1990) • Except LA, largest metros have higher transit mode split • NY (26.9% ) twice as Chicago (13.4%) • See table next
Commuter types & their share • Work and live in central cities • Work in central cities but live in suburbs • Work and live in suburbs (16.1%) (8.0%) (1.6%) Income increases
Employment and density Income increases & Car ownership Lower density of housing arrangement Decline in central city population Disperse employment pattern Transit is NOT attractive
Transit effectiveness • Operating costs of transit depends on population density • Which is more cost effective? • Bus or rail-based transit • For medium density, buses (exclusive ROW) is more effective • For high density, rail is more effective
One-way pass trip operating costs (medium density) $ cents Rail Exclusive Bus-way Car Flier Bus 60 40 (thousands) 0