Download

1 / 34
340 likes | 351 Views
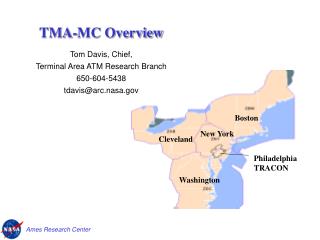
Mr. Cleveland Thomas. Vice Chairman. Working Party 2/3. Study Group 3. ITU-T. Botswana. July 2002. Global Trends in Telecom Development & Study Group 3 Activities. Global trends in telecom development & Study Group 3 Activities. The state of the industry The state of the market

E N D
Mr. Cleveland Thomas Vice Chairman Working Party 2/3 Study Group 3 ITU-T
Botswana July 2002
Global Trends in Telecom Development & Study Group 3 Activities
Global trends in telecom development & Study Group 3 Activities • The state of the industry • The state of the market • Situation in the Regions
A Mobile Revolution Fixed Lines vs. Mobile Users, worldwide, Million 1'400 Mobile Users 1'200 Fixed Lines 1'000 800 600 400 200 0 1993 1995 1997 1999 2001 2003 Source: ITU World Telecommunication Indicators Database.
1000 Actual 900 Other: Data, Internet, 800 13% Leased lines, telex, etc Projected 700 Mobile 600 36% Service revenue (US$ bn) 500 Int'l 8% 400 300 200 43% Domestic Telephone/fax 100 0 90 91 92 93 94 95 96 97 98 99 00 01 02 Source: ITU. Projection of revenue growth (US$bn)
M. US$ (180%) (227%)
180,000 160,000 140,000 120,000 Capacity (Mbps) 100,000 80,000 60,000 40,000 20,000 0 1995 1996 1997 1998 1999 2000 Unused Data Basic voice telephony Source: FCC Use of international circuits from the USA
Internet users, millionsAnnual rate of change Source: ITU.
The state of the market • Increasing competition • Around two-thirds of telecom subscribers now have a choice of operator • More than 99 per cent of mobile and Internet subscribers now have a choice of operator • Dominantly private-ownership • 19 out of top 20 top public telecom operators are partially or fully private-owned • Of the top 20 mobile operators, 16 are fully-private, 3 are partially private, 1 is state-owned • Independent regulators • There are currently 112 independent regulators (only 12 in 1990)
Private, competitive, mobile & global Status of telecommunication privatization , by country and by share of global revenue, 2001
Legal status of competition Distribution by country, 2001 Legal status of telecommunication competition, by country, 2001
Mobile as the new global network Mobile and fixed telephone subscribers worldwide, 1982-2005
Total telephone users (fixed plus mobile) per 100 inhabitants
Distribution of population, main telephone lines, mobile cellular subscribers and Internet users by country economic classification, 2001
Growth in fixed line teledensity, Chile and Argentina, 1986-2000
Growth in mobile teledensity, Hong Kong SAR and Singapore, 1988-2000
Rank Rank Country 2000 1990 2000 1990 Change Armenia 15.6 15.7 102 60 -42 Iraq 2.9 3.9 149 109 -40 Tajikistan 3.6 4.5 143 105 -38 Uzbekistan 6.9 6.9 128 92 -36 Kyrgyzstan 7.9 7.2 125 90 -35 Angola 0.7 0.8 177 146 -31 Liberia 0.2 0.4 190 162 -28 DPR Korea 4.6 3.8 138 111 -27 Canada 96.1 58.6 33 6 -27 Turkmenistan 8.4 6.0 123 97 -26 Cuba 4.4 3.1 140 115 -25 Moldova 16.5 10.6 99 74 -25 Kazakhstan 12.5 8.0 111 87 -24 Comoros 1.0 0.8 171 149 -22 Ukraine 22.7 13.6 87 66 -21 Teledensity with falling rank
Telephony : Some DATA(2000)Intern’l Telephone revenue : 54 billion US $Settlement transaction : 27 billion US $Net Settlement payment to developing countries amount to around : 5 billion US$Int’l Infrastructure costs reduction: < 20 %Annual average traffic increase : 8 % Average Settlement rate reduction: ? %
Traditional regime:Joint provision of service Country A Country B X X Two different national operators jointly establish an international circuit and decide the revenue they wish to obtain. They then divide that revenue fifty-fifty split.
Emerging regime:Market entry and interconnection Jointly provided circuit Country B Country A X X X Circuit provided by operator B Cross border interconnection and the trading of international traffic minutes