Download
1 / 34
340 likes | 345 Views
COMPARATIVE ADVANTAGE OF PUBLIC OWNERSHIP: EVIDENCE FROM U.S. ELECTRIC UTILITIES. John Kwoka Professor of Economics Northeastern University. BACKGROUND. Megginson and Netter (2001):

E N D
COMPARATIVE ADVANTAGE OF PUBLIC OWNERSHIP:EVIDENCE FROM U.S. ELECTRIC UTILITIES John Kwoka Professor of Economics Northeastern University
BACKGROUND • Megginson and Netter (2001): “Research now supports the proposition that privately owned firms are more efficient and more profitable than otherwise-comparable state-owned firms”
Boardman and Vining (1989): Only “…weak support for the hypothesis that public enterprises perform less efficiently” • Peters (1993): “The evidence indicates quite strongly that there is either no statistically significant difference …or that nonprofit [publicly owned] utilities in fact outperform for-profit utilities”
REASONSFORDIFFERENTFINDINGS • Measurement: • Subsidies • Intervening factors: • Regulation • Competition • BUT…differences in results persist even after correcting for these factors
THEORETICALDEVELOPMENTS • Laffont and Tirole (1991): Manager of regulated firm is agent with two principals • Dilutes incentives • Creates externalities among parties with residual rights of control • Shapiro and Willig (1993): Public ownership provides • Better access to information • Needed by regulator in its task
Hart, Schleifer, and Vishny (1997): Contractual incompleteness results in • Stronger incentives for private entity to pursue objective that is easily observed and rewarded • Lower “quality” • Laffont and Tirole (1993) conclude: “ Theory alone is unlikely to be conclusive…”
REASONSTOTHINKTHESEFACTORSMATTER • Wide range of empirical findings about public vs. private enterprise • Remains true even after corrections • Results seem to vary by industry • Systematic pattern to local services • Boardman and Vining’ s survey reports - Private ownership clearly better in 6 of 9 industries - Some mix of evidence in two other cases (water, refuse) - Even division of studies in electric power
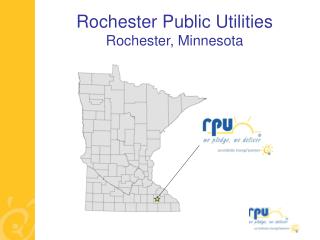
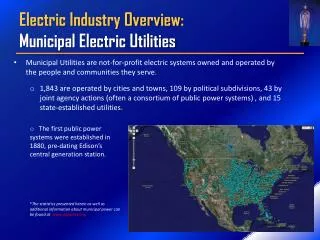
METHODOLOGY • Examine a single industry • Holds much else constant, including competition and regulation • Solves problem of comparison group • Study the electric power industry in U.S. • Many public and private enterprises • Both perform similar functions-generation, transmission, distribution • Intensively studied industry, with conflicting results
Functions differ in contractible quality and informational properties Generation is • Large-scale production activity • Impersonal wholesale markets • Informed buyers • Contractual penalties Distribution is • Oriented toward end-users • Numerous, mostly small • Service more important but difficult to specify • Weaker contractual provisions
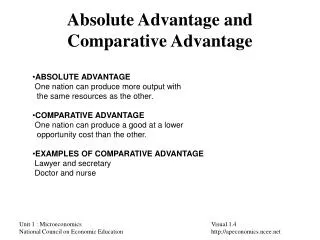
IMPLICATIONS • Characteristics of product, buyers, and transaction suggest • Public enterprise more suited to distribution function • Private enterprise better equipped to perform generation HYPOTHESIS AND TEST • Publicly owned and privately owned electric utilities each specialize where they have a comparative advantage • Need to look at electric utilities distinguishing each output, rather than at entire enterprises
DATA OVERVIEW • 543 utilities in data base • 396 public systems, 147 private • Account for 87% output in 1989 • Patterns of generation • 139 of 147 private systems generate • Only 163 of 396 public systems do
EMPIRICAL MODEL • Basic model is multi-product quadratic cost function C(DIST, GEN) = a1 + a11 DIST + a12 DISTSQ + a21 GEN + a22 GENSQ + a3 DIST•GEN + e • Allows for: • economies of scale in distribution and in generation • economies of multi-product operation
Total cost measured by • Operation and maintenance • Depreciation and amortization • Cost of capital • Public “subsidies” • Control variables include • Prices of fuel, labor, capital • Number of customers • Percent generation capacity that is hydro/nuclear/steam • Purchased power • Holding company subsidiary
MULTIPRODUCT COST FUNCTION WITH ECONOMIES OF SCALE AND MULTIPRODUCT ECONOMIES
REGRESSION ANALYSIS OF EFFECT OF PUBLIC OWNERSHIP ON TOTAL COST
REGRESSION ANALYSIS OF EFFECT OF PUBLIC OWNERSHIP ON TOTAL COST
REGRESSION ANALYSIS OF EFFECT OF PUBLIC OWNERSHIP ON TOTAL COST
RESULTS • Distribution output produced more cheaply by publicly owned systems • Generation performed more cheaply by private systems • Public systems also have lower fixed costs
Estimates imply lower overall distribution cost for public ownership when: - 36.0 DIST + 2.38(10-6) DISTSQ < 32.3(1012) or DIST < 16.0 million mwh
Cost PUBLIC OVERALL Distribution 16M ESTIMATED EFFECT OF PUBLIC OWNERSHIP ON DISTRIBUTION COST
Cost PUBLIC OVERALL Generation ESTIMATED EFFECT OF PUBLIC OWNERSHIP ON GENERATION OUTPUT
NET SIZE EFFECTS • Results imply weakened incentives in large distribution systems, even if publicly owned • Of 396 public systems in data base, 394 have distribution output < 16.0 million mwh
NET OWNERSHIP EFFECT • Overall cost effect of public ownership depends on actual DIST and GEN • At mean values of DIST and GEN, net cost difference in favor of public systems = 2.5%
QUALITY • We need to examine quality • Theory emphasizes unobservable quality • Possible that lower costs due to poorer quality • Quality evidence much sparser • Some data on System Average Interruptible Duration Index, defined as average annual number of minutes that a customer is without service
CONCLUSIONS REGARDING QUALITY • No evidence that cost effect is due to lesser quality of service by publicly owned systems • Evidence is that they provide higher quality service • Best evidence also suggests that both the quality and the cost effects are size-dependent
METHODOLOGICAL NOTE • Past studies of the effects of public ownership come to variety of conclusions • Reasons: • Inadequate controls • Inadequate data bases • Inflexible modeling • Inattention to generation vs. distribution
Inattention to distinction between generation and distribution can mislead • Regression with simple fixed effects term for PUBLIC ownership • standard approach • results in insignificant coefficient on PUBLIC • This specification hides very different effects of ownership in generation vs. distribution
CONCLUSIONS • Substantive: • No simple conclusion about public vs. private utilities • Each has comparative advantage • Methodological: • Draws on modern theory • Illustrates importance of flexible specification
Policy: • Neither public nor private ownership is always better • Important to identify underlying conditions in order to determine which regime is better suited to circumstance - Product characteristics - Transaction characteristics - Buyer characteristics - Market characteristics