Download
1 / 35
350 likes | 354 Views
This presentation discusses the strategies and results of studying the critical point in the phase diagram for hot and dense nuclear matter. It explores the use of finite-size scaling to locate and characterize the critical end point (CEP) and emphasizes the importance of understanding the phases of matter. The presentation also touches on the quantum chromodynamics (QCD) phase diagram and the challenges in experimental verification and characterization of the CEP.

E N D
Observation of the Critical Point in the Phase Diagram for Hot and Dense Nuclear Matter Roy A. Lacey Stony Brook University Roy.Lacey@Stonybrook.edu • Outline • Introduction • Phase Diagram & its ``landmarks” • Strategy for CEP search • Anatomical & operational • Finite Size Scaling (FSS) • Basics • Scaling Examples • Results • FSS functions for susceptibility • FSS functions for fluctuations • Dynamic FSS • Epilogue • Essential points; • Finite-Size Scaling provides an important “window” for locating and characterizing the CEP • The existence of the CEP is not a moot point Roy A. Lacey, International School of Physic, 38th Course, Erice, Sept. 16-24, 2016
Characterizing the phases of matter Phase diagram for H2O The location of the critical End point (CEP) and the phase coexistence regions are fundamental to the phase diagram of any substance ! Critical Point End point of 1st order (discontinuous) transition The properties of each phase is also of fundamental interest Roy A. Lacey, International School of Physic, 38th Course, Erice, Sept. 16-24, 2016
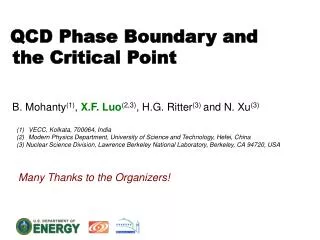
QCD Phase Diagram Quantitative study of the QCD phase diagram is a current focus of our field Essential question: What new insights do we have on the CEP “landmark” from the RHIC beam energy scan (BES-I)? • Its location ()? • Its static critical exponents - ? • Static universality class? • Order of the transition • Dynamic critical exponent/s – z? • Dynamic universality class? All are required to fully characterize the CEP Focus: The use of Finite-Size/time Scaling to locate and characterize the CEP! Roy A. Lacey, International School of Physic, 38th Course, Erice, Sept. 16-24, 2016
Large scale correlated fluctuations of the order parameter [OP] develop • The correlation length“diverges” • and renders microscopic details irrelevant for critical behavior . • Only the structure of the correlations matter – spatial dimension (d) tensor character (n) of the OP • Diverse systems can be grouped into universality classes (d, n) displaying the same static/dynamic behavior characterized by critical exponents The CEP “Landmark” Transitions are anomalous near the CEP Critical opalescence [CO2] 3D-Ising Universality Class The critical end point is characterized by singular behavior at T = Tc+/- Roy A. Lacey, International School of Physic, 38th Course, Erice, Sept. 16-24, 2016
QCD Knowns & unknowns Experimental verification and characterization of the CEP is an imperative Known known Theory consensus on the static universality class for the CEP 3D-Ising Z(2), Summary - M. A. StephanovInt. J. Mod. Phys. A 20, 4387 (2005) • Known unknowns • Location () of the CEP? • Summary - M. A. Stephanov Int. J. Mod. Phys. A 20, 4387 (2005) • Dynamic Universality class for the CEP? • One slow mode (L), z ~ 3 - Model H • Son & Stephanov, Phys.Rev. D70 (2004) 056001 • Moore & Saremi, JHEP 0809, 015 (2008) Scaling relations • Three slow modes (NL) • zT ~ 3 • zv ~ 2 • zs ~ -0.8 [critical speeding-up] • Y. Minami - Phys.Rev. D83 (2011) 094019 [critical slowing down] Ongoing beam energy scans to probe a large (T,) domain Roy A. Lacey, International School of Physic, 38th Course, Erice, Sept. 16-24, 2016
Operational Strategy( Near the CEP, anomalous transitions can influence reaction dynamics and thermodynamics experimental signatures for the CEP (,T) at chemical freeze-out J. Cleymans et al. Phys. Rev. C73, 034905 Andronicet al. Acta. Phys.Polon. B40, 1005 (2009) • LHC access to high T and small • RHICaccess to different systems and • a broad domain of the (,T)-plane RHICBES to LHC 360 increase Vary to explore the ()-plane for experimental signatures which could signal the CEP Roy A. Lacey, International School of Physic, 38th Course, Erice, Sept. 16-24, 2016
Anatomy of search strategy Anomalous transitions near the CEP lead to critical fluctuations of the conserved charges (q = Q, B, S) The moments of the distributions grow as powers of Cumulants of the distributions Familiar cumulant ratios **Fluctuations can be expressed as a ratio of susceptibilities** A pervasive idea use beam energy scans to vary T, and search for enhanced/non-monotonic fluctuation patterns Proviso Finite size/time effects Roy A. Lacey, International School of Physic, 38th Course, Erice, Sept. 16-24, 2016
Anatomy of search strategy O • Other thermodynamic quantities show (power law) divergences • Similarly use beam energy scans to vary T, and search for the influence of such divergences on reaction dynamics! • Important proviso: • Finite size/time effects can significantly dampen divergences weak non-monotonic response? Roy A. Lacey, International School of Physic, 38th Course, Erice, Sept. 16-24, 2016
Anatomy of search strategy • Inconvenient truths: • Finite-size and finite-time effects complicate the search and characterization of the CEP • They impose non-negligible constraints on the magnitude of ξ. • The observation of non-monotonic signatures, while helpful, is neither necessary nor sufficient for identification and characterization of the CEP. • The prevailing practice to associate the onset of non-monotonic signatures with the actual location of the CEP is a ``gimmick’’ . • A Convenient Fact: • The effects of finite size lead to specific volume dependencies which can be leveraged, via scaling, to locate and characterize the CEP This constitutes the only credible approach to date! Roy A. Lacey, International School of Physic, 38th Course, Erice, Sept. 16-24, 2016
Basics of Finite-Size Effects Illustration large L T > Tc small L Lcharacterizes the system size T close to Tc note change in peak heights, positions & widths A curse of Finite-Size Effects (FSE) Only a pseudo-critical point is observed shifted from the genuine CEP Roy A. Lacey, International School of Physic, 38th Course, Erice, Sept. 16-24, 2016
Finite-size effects on the sixth order cumulant -- 3D Ising model The curse of Finite-Size effects Influence of FSE on the phase diagram Pan Xue et al arXiv:1604.06858 E. Fraga et. al. J. Phys.G 38:085101, 2011 FSE on temp dependence of minimum ~ L2.5n Displacement of pseudo-first-order transition lines and CEP due to finite-size • A flawless measurement, sensitive to FSE, can Not locate and characterize the CEP directly • One solution exploit FSE Roy A. Lacey, International School of Physic, 38th Course, Erice, Sept. 16-24, 2016
The Blessings of Finite-Size critical exponents M. Suzuki, Prog. Theor. Phys. 58, 1142, 1977 L scales the volume Finite-size effects have a specific influence on the succeptibility • The scaling of these dependencies give access to the CEP’s location, critical exponents and scaling function. Roy A. Lacey, International School of Physic, 38th Course, Erice, Sept. 16-24, 2016
Model demonstration of Finite-Size Scaling Locating the CEP and via the susceptibility -- 2D-Ising model Finite-Size Scaling of the peak position gives the location of the deconfinement transition and the critical exponent Roy A. Lacey, International School of Physic, 38th Course, Erice, Sept. 16-24, 2016
Model demonstration of Finite-Size Scaling Extracton of via the susceptibility -- 2D-Ising model Finite-Size Scaling of the peak heights give Recall; these critical exponents reflect the static universality class and the order of the phase transition Roy A. Lacey, International School of Physic, 38th Course, Erice, Sept. 16-24, 2016
Model demonstration of Finite-Size Scaling Extracton of the scaling function for the susceptibility -- 2D-Ising model M. Suzuki, Prog. Theor. Phys. 58, 1142, 1977 The susceptibility observed for different system sizes, can be re-scaled to an identical Scaling function Roy A. Lacey, International School of Physic, 38th Course, Erice, Sept. 16-24, 2016
**Fluctuations susceptibility ratio** Model demonstration of Finite-Size Scaling Extracton of the scaling function for critical fluctuations -- 3D-Ising model Values for the CEP + Critical exponents Corollary: Scaling function can be used to extract critical exponents and the location of the CEP Roy A. Lacey, International School of Physic, 38th Course, Erice, Sept. 16-24, 2016
Model demonstration of Finite-Size Scaling **Fluctuations susceptibility ratio** Extracton of the scaling function for critical fluctuations -- 3D-Ising model Values for the CEP + Critical exponents Corollary: Scaling function can be used to extract critical exponents and the location of the CEP Roy A. Lacey, International School of Physic, 38th Course, Erice, Sept. 16-24, 2016
Experimental Results Strategy The scaling functions for the susceptibility and critical fluctuations (susceptibility ratios) should result from the same values of the CEP and critical exponents! Extract scaling functions for the susceptibility and critical fluctuations (susceptibility ratios)? Interferometry measurements used as a susceptibility () probe Fluctuations measurements used as a susceptibility-ratio probe Phys.Rev.Lett. 114 (2015) no.14, 142301 arXiv:1606.08071 Roy A. Lacey, International School of Physic, 38th Course, Erice, Sept. 16-24, 2016
Statistical Mechanics – Not serendipity Compressibility For an isothermal change Stoki´c, Friman, and K. Redlich, Phys.Lett.B673:192-196,2009 From partition function one can show that The compressibility diverges at the CEP At the CEP the inverse compressibility 0 Scaling function provides an independent measure! Roy A. Lacey, International School of Physic, 38th Course, Erice, Sept. 16-24, 2016
Source function (Distribution of pair separations) Correlation function Encodes FSI Interferometry Measurements 3D Koonin Pratt Eqn. The space-time dimensions of the Emitting source , and ) can be extracted from two-pion correlation functions Two pion correlation function Inversion of this integral equation Source Function (, , ) q = p2 – p1 S. Afanasiev et al. PRL 100 (2008) 232301 Interferometry measurements give access to the space-time dimensions of the emitting source produced in the collisions Roy A. Lacey, International School of Physic, 38th Course, Erice, Sept. 16-24, 2016
Interferometry as a susceptibility probe The measured radii encode space-time information for the reaction dynamics Hung, Shuryak, PRL. 75,4003 (95) T. Csörgő. and B. Lörstad, PRC54 (1996) 1390-1403 Chapman, Scotto, Heinz, PRL.74.4400 (95) Makhlin, Sinyukov, ZPC.39.69 (88) emission duration • The divergence of the susceptibility • “softens’’ the sound speed cs • extends the emission duration emission lifetime • (Rside- Rinit)/Rlong sensitive to cs • Specific non-monotonic patterns expected as a function of √sNN • A maximum for (R2out - R2side) • A minimum for (Rside- Rinitial)/Rlong (R2out - R2side) sensitive to the Roy A. Lacey, International School of Physic, 38th Course, Erice, Sept. 16-24, 2016
dependence of interferometry signal Lacey QM2014 . Adare et. al. (PHENIX) arXiv:1410.2559 The measurements validate the expected non-monotonic patterns! ** Note that , and [all] increase with ** • Confirm the expected patterns for Finite-Size-Effects? • Use Finite-Size Scaling (FSS) to locate and characterize the CEP Roy A. Lacey, International School of Physic, 38th Course, Erice, Sept. 16-24, 2016
Phys.Rev.Lett. 114 (2015) no.14, 142301 • The data validate the expected patterns for Finite-Size Effects • Max values decrease with decreasing system size • Peak positions shift with decreasing system size • Widths increase with decreasing system size Perform Finite-Size Scaling analysis with length scale Roy A. Lacey, International School of Physic, 38th Course, Erice, Sept. 16-24, 2016
Lacey QM2014 . Adare et. al. (PHENIX) arXiv:1410.2559 Length Scale for Finite Size Scaling is a characteristic length scale of the initial-state transverse size, σx & σy RMS widths of density distribution scales the volume • scales the full RHIC and LHC data sets Roy A. Lacey, International School of Physic, 38th Course, Erice, Sept. 16-24, 2016
critical exponents Phys.Rev.Lett. 114 (2015) no.14, 142301 From slope From intercept ** Same value from analysis of the widths ** • The critical exponents validate • the 3D Isingmodel (static) universality class • 2nd order phase transition for CEP ( & chemical freeze-out systematics) Roy A. Lacey, International School of Physic, 38th Course, Erice, Sept. 16-24, 2016
Phys.Rev.Lett. 114 (2015) no.14, 142301 • 2nd order phase transition • 3D Ising Model (static) universality class for CEP M. Suzuki, Prog. Theor. Phys. 58, 1142, 1977 Use , , and to obtain Scaling Function **Scaling function validates the location of the CEP and the (static) critical exponents** are from Roy A. Lacey, International School of Physic, 38th Course, Erice, Sept. 16-24, 2016
(STAR) Phys.Rev.Lett. 112 (2014) 032302 Cumulants of the distributions **Fluctuations susceptibility ratio** Scaling functions are derived from these data Roy A. Lacey, International School of Physic, 38th Course, Erice, Sept. 16-24, 2016
arXiv:1606.08071 Compressibility • Fluctuation measurements • + M. Suzuki, Prog. Theor. Phys. 58, 1142, 1977 The scaling functions for the critical fluctuations should result from the same values of the CEP and critical exponents ** The compressibility diverges at the CEP ** Validation of the location of the CEP and the (static) critical exponents Use , , to obtain Scaling Function are from Roy A. Lacey, International School of Physic, 38th Course, Erice, Sept. 16-24, 2016
arXiv:1606.08071 • Fluctuation measurements • + M. Suzuki, Prog. Theor. Phys. 58, 1142, 1977 The scaling functions for the critical fluctuations should result from the same values of the CEP and critical exponents Use , , to obtain Scaling Function ** Validation of the location of the CEP and the (static) critical exponents ** Roy A. Lacey, International School of Physic, 38th Course, Erice, Sept. 16-24, 2016
arXiv:1606.08071 • Fluctuation measurements • + M. Suzuki, Prog. Theor. Phys. 58, 1142, 1977 Use , , to obtain Scaling Function **further validation of the location of the CEP and the (static) critical exponents** Roy A. Lacey, International School of Physic, 38th Course, Erice, Sept. 16-24, 2016
arXiv:1606.08071 • Fluctuation measurements • + M. Suzuki, Prog. Theor. Phys. 58, 1142, 1977 Use incorrect values for , to obtain Scaling Function ** Invalidate incorrect CEPlocation ** Roy A. Lacey, International School of Physic, 38th Course, Erice, Sept. 16-24, 2016
A What about Finite-Time Effects (FTE)? diverges at the CEP so relaxation of the order parameter could be anomalously slow An important consequence Non-linear dynamics Multiple slow modes zT~ 3, zv~ 2,zs~ -0.8 zs< 0 - Critical speeding up z > 0 - Critical slowing down Y. Minami - Phys.Rev. D83 (2011) 094019 dynamic critical exponent Significant signal attenuation for short-lived processes with zT ~ 3 or zv ~ 2 eg. ~ (without FTE) ~ (with FTE) **Note that observables driven by the sound mode would NOT be similarly attenuated** The value of the dynamic critical exponent/s is crucial for HIC Dynamic Finite-Size Scaling (DFSS) can be used to estimate the dynamic critical exponent z employed in this study Roy A. Lacey, International School of Physic, 38th Course, Erice, Sept. 16-24, 2016
**Experimental estimate of the dynamic critical exponent** • 2nd order phase transition DFSS ansatz at time when T is near Tcep For T =Tc The magnitude of z is similar to the predicted value for zs but the sign is opposite M. Suzuki, Prog. Theor. Phys. 58, 1142, 1977 Roy A. Lacey, International School of Physic, 38th Course, Erice, Sept. 16-24, 2016
Epilogue Strong experimental indication for the CEP and its location • New Data from RHIC (BES-II) together with theoretical modeling, can provide crucial validation tests for the coexistence regions, as well as to firm-up characterization of the CEP! (Dynamic) Finite-Size Scalig analysis • 3D Ising Model (static) universality class for CEP • 2nd order phase transition • Landmark validated • Crossover validated • Deconfinement • validated • (Static) Universality • class validated • Model Hdynamic • Universalityclass • invalidated? • Other implications! Much additional work required to get to “the end of the line” Roy A. Lacey, International School of Physic, 38th Course, Erice, Sept. 16-24, 2016
End Roy A. Lacey, International School of Physic, 38th Course, Erice, Sept. 16-24, 2016