Download
1 / 26
260 likes | 349 Views
Data Structures. Methods of Economic Investigation Lecture 2. Why are we doing this?. Thus far: Most of econometrics teaching has been theory based Type of data can drive what you can do Type of data affects credibility and problems with analysis

E N D
Data Structures Methods of Economic Investigation Lecture 2
Why are we doing this? • Thus far: Most of econometrics teaching has been theory based • Type of data can drive what you can do • Type of data affects credibility and problems with analysis • Can be hard to translate equations into applications and even into reading papers • Rest of this course based on applications: this lecture will help with both lectures and exercises
Choosing your data.. Suppose interested in causal effect of X on y: How would you test this? If you could choose the way in which X is determined in your sample—what would you do may seem fanciful but field experiments becoming more common in economics Good thought experiment: If you could have any data in the world, is this question answerable (if not, move on!) Good reason to choose to do randomized controlled experiment
Where does data come from? • Surveys • Response Rate • Stratification/Clusters • Reporting Error/Measurement Error • Administrative Records • Lots of different places • Often kept real-time (so addresses “reporting” or “recollection” errors) • May be missing, and that might not be random… • Researchers (and you!) • Often collected for specific project—so be careful what it has • More “unique” with different types of data (e.g. content analysis)
Who Collects Data • Government • Official Statistics: Unemployment, GDP, etc • Surveys: Labor Force, Consumption, etc. • Records: Justice System, Social Programs • Service providers • Often this may be administrative (e.g. hospital records) • Sometimes, internal surveys or evaluations which can be useful if you can get them • Third Parties • Critical for places with limited capacity (e.g. World Bank is a big source of this for developing countries) • University or Survey Research Programs • Newspapers and Media sources compile LOTS of things
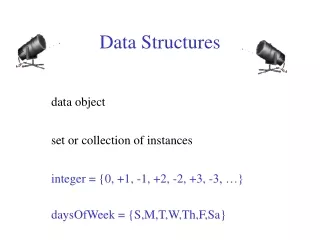
Different Types of data • Cross-Sectional Data • Time Series Data • Panel Data • Repeated Cross-Section
Cross-Sectional Data • Cross section data covers a cross section of population and information is collected from this cross section during a given period of time. • What does this look like • Rows are units of observations (e.g. individuals) • Columns may be variables
Cross-Section Data • Simple descriptive statistics across individuals: can get sample mean and variance of various X’s • Regressions: The standard formulas
AlgebraReality: Outcome Variables • Try to get a sense of data, to translate the matrix algebra into reality. • What is the effect of education on income? • We have an Outcome “y”, for example income
AlgebraReality: RHS Variables • There may be several (labeled by k) different X’s. So usually we think of this as meaning that: • X is of dimensionality kxn • We will estimate k coefficients • Our X variables looks like:
Our Data Looks like: Our Data Example • N=5 • k=3 We can index our individuals by ID (useful later)
What does a regression tell us? • Remember, it’s minimizing the errors and will pick the 3 coefficients (one on race, one on sex, and one on education) to do that • We are interested in the coefficient on education to tell use the “effect of education on earnings” • We might still care about the effect of race and gender as “control” variables
AlgebraReality: Stata Output • Using our “data” if we regress y on our X’s • To do this in stata we would tell stata: regress income race sex education • Output: • Coefficients • Standard errors • R-squared
Limitations… • Lots of things vary over time • Can’t control for these issues in cross-section data • Only source of variation is across individuals (or whatever the unit of observation) • Identification: Need observations similar time characteristics (because we can’t control this) but different on some variable of interest
Now to time series data • Pretty similar to panel data except data indexed by time instead of individual
Why is time series different? • Correlation between different observations • Violates OLS assumptions (estimates ok but can’t do inference) • More on this later… • Lots of things about individuals are time-invariant so they don’t make sense in this context. • Other things, often in time series data, are common across individuals (e.g. macroeconomic trends) • Limits what we can do with these variables—we CAN’T “control” for time-invariant characteristics so all variation comes from time variation…
Estimating with Time Series Data • Two critical issues: • Stationary: Mean and Variance not changing over time • Stronger conditions sometimes required which is that distribution (e.g. all moments) same over time/space • May need to do something to make your data stationary (e.g. de-mean, detrend, difference, etc.) • Ergodic • Given a sufficiently long set of realizations, can estimate statistical properties • Worry about Unit roots (more on this later)
Panel Data • Repeated observation on individuals • Common example: Labor Force Surveys • Take information about individuals • Usually contains time invarying for any individual (race, sex, education level) • Usually contains time varying for any given individual (employed last week) • Can contain or link to time varying but same across groups of individuals (local unemployment rate)
Example of Panel Data • Multi-dimensional—so indexed by time & individual
Panel Data Regressions • Regressions need to be indexed by all dimensions (our example is time and individual but it could be time, state, and individual) • May allow intercept shift (e.g. add a dummy for each year) • May allow a slope shift (e.g. allow different coefficients for men and women)
What’s so great about Panel Data? • We can control for individual specific factors (e.g. error component models) • ECM may solve some of our omitted variable bias issues (individual controls) • Can use both “within” (for an individual over time) and “between variation (across individuals in a given time) • Can be rare to have long panels • Tend to span very short periods of time • May make it difficult to study trends—can only see “breaks” at big changes
Repeated Cross-Section Data • More common—Annual or Frequent Surveys—not always same people • Get repeated cross-section, of different cohorts of individuals • Can do several things: • Construct panel at more aggregate level • Use time-series aspects to compare cohorts
Example of Cross-Section Data • Multi-dimensional—so indexed by time & individual
Repeated Cross-Section Regressions • Index by time and whatever “group” you want to use—for example: group 1 is men and group 2 is women, then you estimate: • Use similarities between groups but can’t control of individual specific issues • Cohort specific changes—selection issues, e.g. • Can allow ‘fixed effects’ for time or group—but not as believable to control for unobservables
Next Steps: • Using data can we: • Describe the data to understand what we’ve got • Develop some “questions” to answer • Test our hypotheses • Application based class—will use Stata examples