Download
1 / 48
480 likes | 495 Views
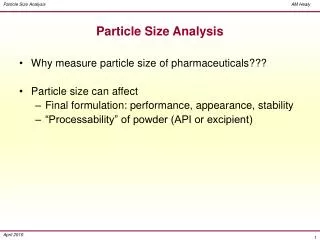
Methods for Measuring Particle Size and Size Distributions Peter H. McMurry Department of Mechanical Engineering University of Minnesota. Measures of Particle Size. Light Scattering: f (n, “size”, shape) Electrical Mobility: g ( “size”, shape)

E N D
Methods for Measuring Particle Size and Size Distributions Peter H. McMurry Department of Mechanical Engineering University of Minnesota
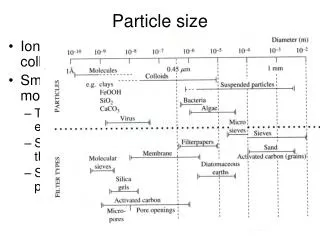
Measures of Particle Size Light Scattering: f (n, “size”, shape) Electrical Mobility: g ( “size”, shape) Aerodynamic size: h (r, “size”, shape) Mass: I (r, “size”) where n = complex refractive index r = particle density “size”= a measure of geometric size (e.g., diameter of sphere)
Measurement of Particle Size Light Scattering: Optical Particle Counter (OPC) Electrical Mobility: Mobility Classifier + Condensation Particle Counter (SMPS) Aerodynamic size: Aerodynamic Particle Sizer Mass: Aerosol Particle Mass Analyzer + Concensation Particle Counter
An Instrument System for Measuring Size Distributions (3 nm - 10 µm)(Used by UMN at St. Louis Supersite)
PM10 Inlet RH Control 38%<RH<42% Nano-SMPS 3 < Dp < 40 nm SMPS 20 < Dp < 300 nm OPC1 (Auto Calibrated hourly @ 450 nm) 0.1 µm < Dp < 2 µm OPC2 (Auto Calibrated hourly @ 450 nm) 0.1 µm < Dp < 2 µm
10000000 1000 1000000 100000 100 10000 1000 10 100 10 1 1 0.1 0.1 0.001 0.01 0.1 1 10 Size Distribution Measured in Atlanta During Nucleation Event (April 1, 1999 12:00; Woo, McMurry et al.) Nucleation Mode Accumulation Mode Aitken Nuclei Mode dV/dLogDp dN/dLogDp Dp, µm
Ultrafine Particle Events Observed in St. Louis(Shi, Sakurai and McMurry) Regional Nucleation Event “SO2 Plume” Event NOx-CO Event (Traffic)
We can do good job (90% data recovery) of measuring size distributions routinely, remotely and continuously (5 minute resolution)However“Size” is not always a well defined parameter, and external mixing further complicates our ability to relate one measure of size to another
Inner electrode Aerosol entrance r r1 r2 High voltage w Outer electrode Mass classified aerosol Z Response of various instruments to DMA-classified particles Dry air Aerosol Inlet Neutralizer APM w 3 1 2 DMA MOUDI OPC (Lasair) CNC 3760 TEM Orifice Vacuum pump 4
DMA + APM Measurements; 1999 Atlanta SuperSite Experiment: Distributions of mass for particles with mobility size =0.309 µm More typical higher mass particles (probably Sulfate/OC spheres) “Fluffy” low mass Particles (probably Soot)
DMA + OPC: Light Scattering response to 450nm diesel soot and atmospheric particles diesel soot dark particles bright particles
Relationship between mobility, optical equivalent and aerodynamic diameters For Diesel Exhaust Particles Relationship between aerodynamic and mobility diameters Relationship between optical equivalent and mobility diameters A PMS Model 1002 Lasair OPC calibrated with DOS spheres measured the optical equivalent size of DMA-classified diesel exhaust particles
DMA + TEM (70 nm mobility size particles (John Deere Engine, 1400 rpm, 10% load, Two distinct peaks are observed when heated)
TDMA Particle Growth Measurements • Ratio of total water volume to dry particle volume: 5 - 85% RH 5% RH Dp(5%) = .05, .1, .2, .3, .4 mm Dp (RH) (Volume addivity assumed)
Separation of “More” and “Less” Hygroscopic Particles by TDMA
Morphology and Composition of a “Less Hygroscopic” Particle (McMurry et al., 1996)
Morphology and Composition of a “More Hygroscopic” Particle (McMurry et al., 1996)
0.5 µm Nonspherical Fractions Dry: RH = 4-10% Wet: RH = 44-76%
Atmospheric Measurements (DMA + MALS) Wet 0.5 µm Dry 0.5 µm
Lecture Outline • Physical Characteristics • Improved measurements of size distributions • Particle nucleation and growth • Particle Properties: • Mixing characteristics • Hygroscopicity, Density, Refractive Index • Chemical Characteristics • Real-time measurements • Single particle mass spectrometry
Instrumentation: 3 nm to 10 µm Size Distributions -RH control -Autocalibrate -Remote control
Comparison of Nanoparticle Growth Rates in St. Louis and Atlanta(Shi, Woo, Sakurai, McMurry; 2003)
Dry air Compressed air Sheath air MFC Wet air HEPA Saturator Dryer Neutralizer APM ω DMA1 DMA2 CNC 3760 Vacuum pump Orifice TDMA-APM system (Park, McMurry et al.)
Application of MALS to Atmospheric Particles(Dick & McMurry, 1998) Wet 0.5 µm Dry 0.5 µm
Model vs. Measured Refractive Index:Application of MALS to 0.3 µm Particles(Dick & McMurry, 1998)
Chemical Characteristics: New Insights from Real-Time Measurements
Florence Satellite Sites Outside Pittsburgh(Stainer, Pandis et al.) Steubenville Wheeling Greensburg Holbrook Athens
Regional Nucleation event in Pittsburgh Area(February 25, 2002; Stainer, Pandis et al.)
Diameter Growth Rate During Regional Nucleation Events in St. Louis(Shi, Sakurai and McMurry, 2003) Particles tend to grow faster in summer
Annual Average Diurnal Patterns in St. Louis and Atlanta: 3 to 10 nm Number Concentrations
Annual Variations in Number Concentrations for St. Louis and Atlanta: 10 to 100 nm
Particle Mass Measurement with the Aerosol Particle Mass Analyzer (APM; Ehara et al., 1996) w High Voltage r qE mw2r
Particles of a Given Mobility Size can have Several Distinct Masses (Effective Densities) (Atlanta ambient aerosols; McMurry et al., 2002)
Effective Densities of Diesel Exhaust Particles (Park, McMurry et al., 2002)
Numerical Simulation of the Formation ofParticle Beams with Aerodynamic Lenses(Peng Liu et al, 1994)
Annual Variations in Number Concentrations for St. Louis and Atlanta: 3 to 10 nm
Annual Average Diurnal Patterns in St. Louis and Atlanta: 10 to 100 nm Number Concentrations
Annual Average Diurnal Patterns in St. Louis and Atlanta: 0.1 to 2 µm Number Concentrations