Download
1 / 71
710 likes | 717 Views
Ocean Resources. Resources and man The ocean reservoir Food resources Mineral resources Energy resources Oceans and the environment Climate change Environmental degradation and waste disposal. Resources and Man. The Malthusian trap The kinds of resources renewable versus nonrenewable

E N D
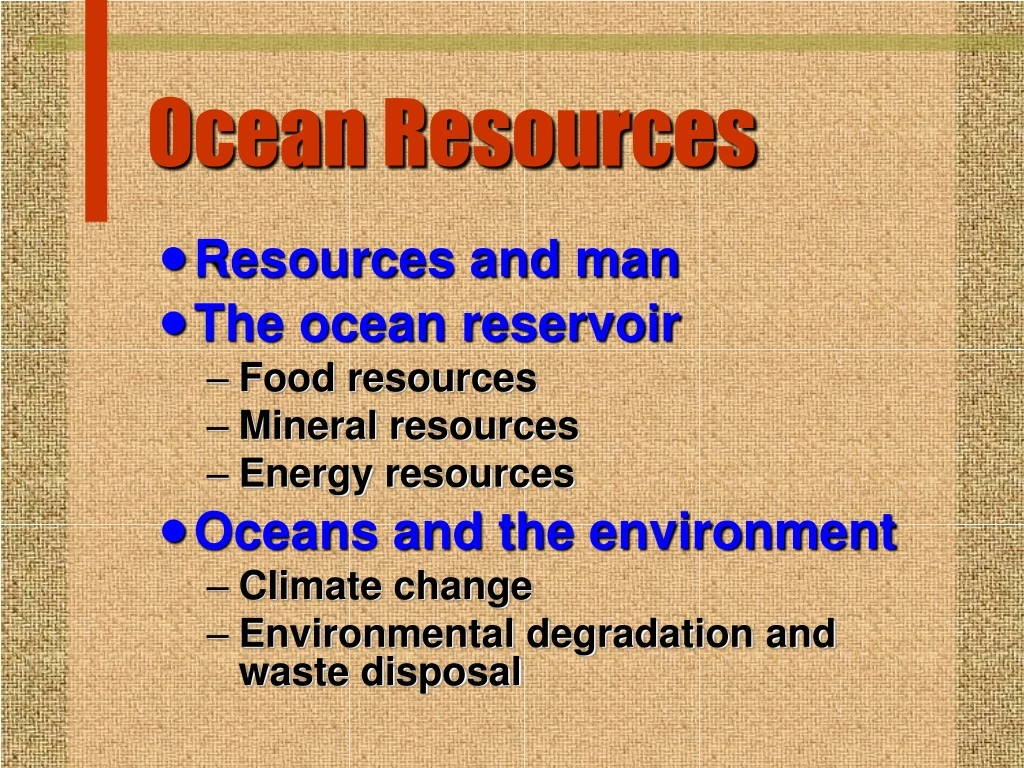
Ocean Resources • Resources and man • The ocean reservoir • Food resources • Mineral resources • Energy resources • Oceans and the environment • Climate change • Environmental degradation and waste disposal
Resources and Man • The Malthusian trap • The kinds of resources • renewable versus nonrenewable • The nature of exhaustibility
Food is the most basic of all our needs SELF- ACTUALI- ZATION ESTEEM SOCIAL SECURITY PHYSIOLOGICAL MASLOW’S HIERARCHY OF NEEDS
Thomas Malthus Thomas Malthus (1766-1834) In“An Essay on the Principles of Population”, published in 1798,Thomas Malthus argued that while population increases in geometric progression, the resources to sustain this growth do not. Thus, if population grows too much faster than food production, this growth is checked by famine, disease, and war.
* This was entitled “An essay on the principles of population as it affects the future improvement of society” In an essay first published* in 1798,Thomas Roberts Malthus argued that “the power of population is indefinitely greater than the power in the earth to produce subsistence for man”.
This should ordinarily signal disaster. Take the case of wolves and moose at Isle Royale National Park, Lake Superior, for instance. 5000 4000 3000 The sustainable levels for Isle Royale inhabitants 2000 50 40 1000 30 20 10 0 1900 1920 1940 1960 1980 2000
World’s population, a little over a billion at the time of Malthus, has multiplied over five-fold since then. 6 4 2 0 1800 1850 1900 1950 2000 Source: A. Maddison, Monitoring the World Economy 1820-1992 (OECD, Paris, 1995).
Measured in inflation-adjusted 1990 dollars, world’s total output, now about $30 trillion, was about $700 billion at the time of Malthus. 30 20 10 0 1800 1850 1900 1950 2000 Source: A. Maddison, Monitoring the World Economy 1820-1992 (OECD, Paris, 1995).
Clearly, economic growth has been more strongly exponential than that of the demand (population growth) that created it. 45 Economy 30 Population 15 0 1800 1850 1900 1950 2000 Source: A. Maddison, Monitoring the World Economy 1820-1992 (OECD, Paris, 1995).
World Grain Output The growth in world’s grain output has been faster than population but world economy has growth even faster. 1 2 3 6 3 4 2 2 1 0 0 6 Gross World Product World Grain Production 4 2 World Population 0 1950 1960 1970 1980 1990 2000
Adam Smith (1723-1790), the British philosopher and economist, argued, in his celebrated treatise An Inquiry into the Nature and Causes of the Wealth of Nations (1776), that every individual in pursuing his or her own good is led, as if by an invisible hand, to achieve the best good for all. Therefore any interference with free competition by the government is almost certain to be injurious.
First Green Revolution in this century took place in developed countries during 1950-70. First Green Revolution
Second Green Revolution has occurred in developing countries since mid-1960s. Second Green Revolution First Green Revolution
Despite the tremendous strides in world grain pro-duction, per capita grain availability has remained unchanged since the mid-1970s*. 2.0 400 1.5 300 1.0 200 0.5 100 1940 1960 1980 2000 *Lester R. Brown: “Facing the Prospect of Food Scarcity” in STATE OF THE WORLD 1997 (Worldwatch Institute, 1997)
Currently, the annual food production world-wide, including grains, poultry, seafood and meat, • is about 4 billion tons per year, or • about 4½ lbs per person per day.
But per capita food consumption varies, worldwide, from ~1500 lbs per year in America, to ~1000 lbs per year in Mediterranean/ Middle East region, and about 500 lbs per year in India and South Asia.
An average American diet world-wide is clearly impossible,without a proportionate increase in the world’s food production.
Instead, our realistic option in the immediate future is an average Mediterranean diet, world-wide, if the population stabilizes at ~8 billion, but World population an average Indian diet, eventually, as the world population reaches 12-15 billion. 5.75 billion 8 billion to 12 billion in 1995 in 2025
Lesson?Get used to the Indian diet!Alternative?Grow more food!
That requires • Land and • water
30 Tropical Forest Farmland Deciduous Forest (seasonal loss of leaves) 15 Coniferous Forest (green year-round) 0 Arctic and alpine treeless areas 0 100 200 300 400 Mean annual precipitation (cm) Being largely stenohumid as well as stenothermal, agricultural crops impose a rather restricted range of climatic conditions. Farmland therefore tends to be in short supply.
Land (29%) Oceans (71%) Most of the Earth is covered by water “...water, water, every where nor any drop to drink!”
In use Oceans (71%) Cultivated 11% Grazed 10% Land (29%) Potential farming 8% Tropical forests Potential grazing 14% Forests, semi-arid 6% Arid Ice, snow, deserts, mountains (51%) Unusable But the supply of land too is limited... and barely a fifth of it is available for farming related activities.
Economic growth exacerbates the demand for water, e.g., • with economic growth at 7-10% per year, poultry consumption is rising at the rate of 15% per year in India, Indonesia and China - the water demands of this nontraditional industry are only likely to grow; • we need about 250,000 gallons of water to produce a ton of corn, 375,000 gallons to produce a ton of wheat, 1,000,000 gallons to produce a ton of rice, and 7,500,000 of water to produce a ton of beef.
to which we should also add industry’s needs. China Public (6%) U.S.A. Industry (7%) Farming (41%) Public (10%) Industry (11%) Farming (85%) Power- Plant (38%) Power- Plant (2%) this comparison of U.S. and China shows how economic growth necessitates increased use of water for nonagricultural purposes. Source: Worldwatch Institute
Considering all sediments* Conventional estimates Total mass (trillion tons) 1,370,000 330,000 20,000 300 13 1,720,313 Share of the hydrosphere 80% 18.8% 1.2% 0.02% 0.0008% 100% Total mass (trillion tons) 1,370,000 7,000 20,000 300 13 1,397,313 Share of the hydrosphere 97% 0.5% 1.4% 0.02% 0.0009% 100% Oceans Pore water in the sediments Ice-caps, glaciers Rivers, lakes Atmospheric moisture Total hydrosphere The availability of water too is a limiting factor. An average human needs about 300,000 gallons of water annually, including 250,000 gallons for growing food. Indeed, nations with under 150,000 gallons of annual per capita water supply face severe limits to their growth. Mass of the present hydrosphere *Karl K. Turekian: GLOBAL ENVIRONMENTAL CHANGE (Prentice Hall, 1996)
Hydrosphere’s lower limit Conventional estimate assumes a total groundwater storage of about 1,700 quadrillion gallons. This gives the estimate of hydrosphere’s total water content as 3.5x10²⁰ gallons. Underground water (0.5%) Surface water (0.02%) Atmospheric moisture (0.001%) Oceans (97%) Ice (1.2%)
An alternate assumption is that pores in sediments contain about 80,000 quadrillion gallons of ground-water (almost 50 times the conventional estimate). This yields an estimate of about 4x10²⁰ gallons of water in the entire hydroshere. Ice (1%) Surface water (0.002%) Atmosphere (0.001%) Ground- water (19%) Groundwater (19%) Oceans (80%)
That Climate Thing • Global warming and its consequences • The anthropogenic contributions
U.S. 20th Century Natural Disaster Fatality-Frequency Plots* 10 Floods Floods Tornadoes Hurricanes 3 Earthquakes Tornadoes 1 Hurricanes 0.3 0.1 Earthquakes 0.03 0.01 1 3 10 30 100 300 1,000 3,000 10,000 Number of Fatalities per Event * S.P. Nishenko and C.C. Barton: “Scaling Laws for Natural Disaster Fatalities” in REDUCTION AND PREDICTABILITY OF NATURAL DISASTERS (Eds: Rundle, Turcotte and Klein) (Addison-Wesley, 1996)
Disasters* by type: 1971-96 High wind: 21% Man-made disasters: 34% Total: 8,219,000 Flood: 19% Other natural disasters: 21% Earthquake: 8% Volcanoes: 1% Landslides: 3% Drought & Famine: 6% * International Federation of Red Cross and Red Crescent Societies (The Economist, Sept 6, 1997)
Global mean temperature change through last century 0.6 0.3 1950-60 Mean level 0.0 - 0.3 5-year running average - 0.6 1900 1950 2000 Source: Thomas Karl and C. Bruce Baker: GLOBAL WARMING UPDATE (NCDC-NOAA, 1994)
The global mean sea-level rise through last century 8 4 Mean 1951-1970 level 0 -4 5-year running average -8 -12 1900 1950 2000 Source: T.P. Barnett, in CLIMATE CHANGE (IPCC Working Group Report: Cambridge University Press, 1990)
Winter conditions in Eastern Europe through the past millenium, based on manuscript records* 0.8 Little Ice Age 0.4 0 -0.4 -0.8 800 1000 1200 1400 1600 1800 2000 * J. Imbrie & K.P. Imbrie: ICE AGES (Enslow Publishers, 1979)
The 1950-91 hydrographic data off California coast show that the sea surface waters (0-100m) became ~0.8oC warmer in the 35-year period between 1950-56 and 1985-91; which DT (oC) 0 0.3 0.6 0.9 1.2 0 100 200 300 Distance off California coast (km) 400 500 400 300 200 100 0 100 500 raised the sea level sur-face by 3.1+0.7 cm. 95 1985-91 Note: Warming by 1oC the top 100 m of ocean with 15oC temperature and 3.4% salinity should raise the sea level by ~2.2 cm. 90 1950-56 85 Source: D. Roemmich, SCIENCE: v. 257, p. 373-375 (July 17, 1992). 80
20% 0% - 20% - 40% - 60% Global warming will hurt the poor nations most! Change in average national crop yield by the year 2,060 compared to yield corresponding to no change in climate (based on the ocean-atmosphere coupling model) - SCIENCE NEWS, Aug 1992
Evaporation 320,000 km3 Evaporation 60,000 km3 Precipitation 95,000 km3 Precipitation 285,000 km3 Run-off 35,000 km3 Ocean Storage 1,370,000,000 km3 The Hydrological Cycle
Colorado River 40 United States 30 Mexico 20 10 1900 1920 1940 1960 1980 2000 Sandra Postel: Forging a Sustainable Water Strategy (STATE OF THE WORLD 1996: Worldwatch Institute , 1996)
Drying of the Aral Sea 80 Aral Sea 60 40 20 0 1940 1960 1980 2000 Sandra Postel: Forging a Sustainable Water Strategy (STATE OF THE WORLD 1996: Worldwatch Institute , 1996)
A century of human induced sea level rise* Removable volume (in 1012 m3) 4.0 3.0 10.0 600.0 0.1 500.0 1.1 2.2 56.0 220.0 3.3 8.6 -1.9 1406.7 Extraction rate (in 1010 m3/yr) 1.20 1.00 1.30 1.00 0.34 1.60 2.70 3.70 0.77 0.47 4.90 0.20 - 19.20 Sea-level rise rate (mm/yr) 0.03 0.03 0.04 0.03 0.01 0.04 0.08 0.10 0.02 0.01 0.14 0.01 - 0.54 Estimated sea-level change to date (mm) 1.10 0.92 1.20 0.56 0.28 0.89 2.20 3.10 1.30 0.78 3.40 1.30 -5.20 11.80 North America High plains Southwest California Africa and Asia Sahara Sahel (soil water) Arabia Aral (Sea: 1960) Aral (groundwater) Caspian (Sea) Caspian (groundwater) Worldwide Deforestation Wetland reduction Dams Total * Walter Newman and Rhodes Fairbridge: The Management of Sea-level Rise (NATURE, v. 320, p. 319-328, 1986). Dork Sahagian, Frank Schwartz and David Jacobs: Direct Anthropogenic Contributions to Sea-level Rise in the Twentieth Century (NATURE: v. 367, p. 54-57, 1994).
The 1900-94 trends reveal a general tendency towards greater precipitation (a) at higher latitudes and (b) on land Change in precipitation (1900-94) 20% 0% Thomas Karl, Neville Nicholls & Jonathan Gregory: THE COMING CLIMATE, Scientific American, May 1997 -20%
Comparing the 1900-94 precipitation change with (a) latitude and (b) land area Precipitation Change (%, 1900-94) - 10 0 10 20 40oN 0o 40oS - 1 0 1 2 Land, as % of Global Surface Area
Evaporation 320,000 km3 Evaporation 60,000 km3 Precipitation 95,000 km3 Precipitation Run-off 35,000 km3 285,000 km3 Ocean Storage 1,370,000,000 km3 The Hydrological Cycle
In summary, • Human ingenuity has defied the “Malthusian Trap”, that the power of population exceeds that of the earth. • This has resulted in modifying the most basic of nature’s processes - the hydrological cycle. • Perhaps technology defies the Gandhian dictum, that “nature has enough for our need, but not for our greed”.
Resources Perpetual or Renewable Exhaustible or Nonrenewable Wind, tides, flowing water Direct solar energy Non- metallic minerals Fossil fuels Metallic minerals Potentially renewable Fresh air Fresh water Fertile soil Bio- diversity
What will happen if world’s population and economic growth continue at the 1990 levels, assuming no major policy changes or technological innovations* Population Resources Pollution 2000 2100 1900 1950 2050 * Donella Meadows et al., Beyond the Limits: Confronting Global Collapse, Envisioning a Sustainable Future (Chelsea Green, 1992)
Exhaustibility of extractive earth resources • is a problem if we take • the Malthusian perspective, that exhaustibility limits socioeconomic growth; • the neo-Malthusian perspective, that resource exploitation has environmental limits; or • the Ricardian perspective, that progressive depletion raises costs and lowers quality; but • poses no problem if we take the cornucopian view, that technological innovation will always provide substitutes and alternates.
TE C0 ekt S = 0 Depletion time based on the “Limits to Growth” scenario* S 5xS S 5xS Aluminium 2003 2027 Chromium 2067 2126 Coal 2083 2122 Cobalt 2032 2120 Copper 1993 2020 Gold 1981 2001 Iron 2065 2145 Lead 1993 2036 Manganese 2018 2066 Molybdenium Natural Gas Nickel Petroleum Platinum Silver Tin Tungsten Zinc 2006 2017 1994 2021 2025 2068 1992 2022 2019 2057 1985 2014 1987 2033 2000 2044 1990 2022 *Depletion time or the exponential index, TE, is computed here by solving this equation
The depletion time of selected resources based on the “Limits to Growth” scenario Five times the current stock Current stock 1960 1980 2000 2020 2040 2060