Download
1 / 40
420 likes | 625 Views
Operations Management Managing Quality Chapter 6. Outline. Tools of TQM Check sheets Scatter Diagrams Cause-and-Effect Diagram Pareto Charts Process Charts Histogram The Role of Inspection When and where to Inspect Source Inspection. Service Industry Inspection.

E N D
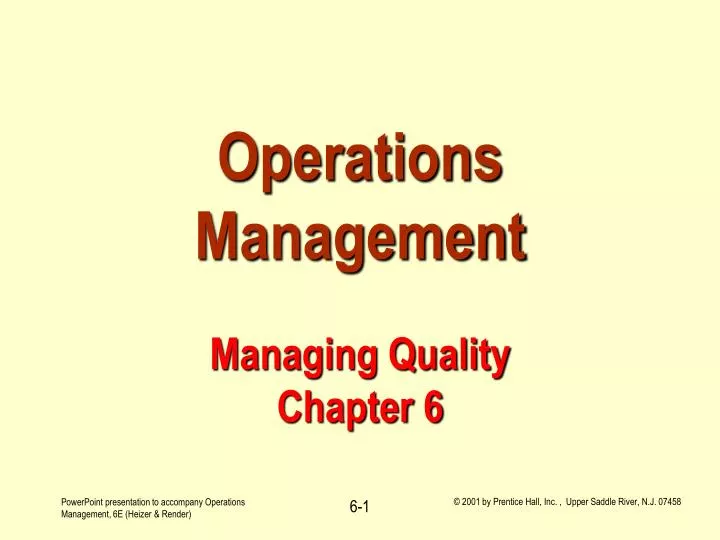
Operations ManagementManaging QualityChapter 6 © 2001 by Prentice Hall, Inc. , Upper Saddle River, N.J. 07458
Outline • Tools of TQM • Check sheets • Scatter Diagrams • Cause-and-Effect Diagram • Pareto Charts • Process Charts • Histogram • The Role of Inspection • When and where to Inspect • Source Inspection © 2001 by Prentice Hall, Inc. , Upper Saddle River, N.J. 07458
Service Industry Inspection • Inspection of Attributes vs Variables • TQM in Services • Process Charts • Histogram • The Role of Inspection • Total Quality Management in Services • Knowledge of TQM Tools © 2001 by Prentice Hall, Inc. , Upper Saddle River, N.J. 07458
Learning Objectives When you complete this chapter, you should be able to : • Identify or Define: • Quality • Malcolm Baldrige National Quality Award • Demings, Juran, and Crosby • Taguchi Concepts © 2001 by Prentice Hall, Inc. , Upper Saddle River, N.J. 07458
Learning Objectives - continued When you complete this chapter, you should be able to : • Explain: • Why quality is important • Total Quality Management (TQM) • Pareto charts • Process charts • Quality robust products • Inspection © 2001 by Prentice Hall, Inc. , Upper Saddle River, N.J. 07458
To Make the Quality Focus Work Motorola: • Aggressively began a worldwide education program to be sure that employees understood quality and statistical process control • Established goals • Established extensive employee participation and employee teams © 2001 by Prentice Hall, Inc. , Upper Saddle River, N.J. 07458
Ways in Which Quality Can Improve Productivity Sales Gains • Improved response • Higher Prices • Improved reputation Improved Quality Increased Profits Reduced Costs • Increased productivity • Lower rework and scrap costs • Lower warranty costs © 2001 by Prentice Hall, Inc. , Upper Saddle River, N.J. 07458
Flow of Activities Necessary to Achieve Total Quality Management • Organizational Practices • Quality Principles • Employee Fulfillment • Customer Satisfaction © 2001 by Prentice Hall, Inc. , Upper Saddle River, N.J. 07458
Organizational Practices • Leadership • Mission statement • Effective operating procedure • Staff support • Training Yields: What is important and what is to be accomplished © 2001 by Prentice Hall, Inc. , Upper Saddle River, N.J. 07458
Quality Principles • Customer focus • Continuous improvement • Employee empowerment • Benchmarking • Just-in-time • Tools of TQM Yields: How to do what is important and to be accomplished © 2001 by Prentice Hall, Inc. , Upper Saddle River, N.J. 07458
Employment Fulfillment • Empowerment • Organizational commitment Yields: Employees’ attitudes that they can accomplish what is important and to be accomplished © 2001 by Prentice Hall, Inc. , Upper Saddle River, N.J. 07458
Customer Satisfaction • Winning orders • Repeat customers Yields: An effective organization with a competitive advantage © 2001 by Prentice Hall, Inc. , Upper Saddle River, N.J. 07458
Definitions of Quality • ASC: Product characteristics & features that affect customer satisfaction • User-Based: What consumer says it is • Manufacturing-Based: Degree to which a product conforms to design specification • Product-Based: Level of measurable product characteristic © 2001 by Prentice Hall, Inc. , Upper Saddle River, N.J. 07458
Dimensions of Quality for Goods • Operation • Reliability & durability • Conformance • Serviceability • Appearance • Perceived quality Quality © 2001 by Prentice Hall, Inc. , Upper Saddle River, N.J. 07458
Market Gains Reputation Volume Price Improved Increased Quality Profits Lower Costs Productivity Rework/Scrap Warranty Importance of Quality • Costs & market share • Company’s reputation • Product liability • International implications © 2001 by Prentice Hall, Inc. , Upper Saddle River, N.J. 07458
Malcom Baldrige National Quality Award • Established in 1988 by the U.S. government • Designed to promote TQM practices • Some criteria • Senior executive leadership; strategic planning; management. of process quality • Quality results; customer satisfaction • Recent winners • Corning Inc.; GTE; AT&T; Eastman Chemical. © 2001 by Prentice Hall, Inc. , Upper Saddle River, N.J. 07458
Baldrige Award Criteria Framework © 2001 by Prentice Hall, Inc. , Upper Saddle River, N.J. 07458
Costs of Quality • Prevention costs - reducing the potential for defects • Appraisal costs - evaluating products • Internal failure - of producing defective parts or service • External costs - occur after delivery © 2001 by Prentice Hall, Inc. , Upper Saddle River, N.J. 07458
EC Environmental StandardISO 14000 Core Elements: • Environmental management • Auditing • Performance evaluation • Labeling • Life-cycle assessment © 2001 by Prentice Hall, Inc. , Upper Saddle River, N.J. 07458
International Quality Standards • Industrial Standard Z8101-1981 (Japan) • Specification for TQM • ISO 9000 series (Europe/EC) • Common quality standards for products sold in Europe (even if made in U.S.) • ISO 14000 series (Europe/EC) • Standards for recycling, labeling etc. • ASQC Q90 series; MILSTD (U.S.) © 2001 by Prentice Hall, Inc. , Upper Saddle River, N.J. 07458
Traditional Quality Process (Manufacturing) Customer Marketing Engineering Operations Specifies Interprets Designs Produces Need Need Product Product Defines Plans Quality Quality Quality is customer driven! Monitors Quality © 2001 by Prentice Hall, Inc. , Upper Saddle River, N.J. 07458
TQM Encompasses entire organization, from supplier to customer Stresses a commitment by management to have a continuing company-wide drive toward excellence in all aspects of products and services that are important to the customer. © 2001 by Prentice Hall, Inc. , Upper Saddle River, N.J. 07458
Achieving Total Quality Management CustomerSatisfaction EffectiveBusiness Attitudes (e.g., Commitment) Employee Fulfillment How to Do Quality Principles What to Do Organizational Practices © 2001 by Prentice Hall, Inc. , Upper Saddle River, N.J. 07458
Deming’s Fourteen Points • Create consistency of purpose • Lead to promote change • Build quality into the products • Build long term relationships • Continuously improve product, quality, and service • Start training • Emphasize leadership © 2001 by Prentice Hall, Inc. , Upper Saddle River, N.J. 07458
Deming’s Points - continued • Drive out fear • Break down barriers between departments • Stop haranguing workers • Support, help, improve • Remove barriers to pride in work • Institute a vigorous program of education and self-improvement • Put everybody in the company to work on the transformation © 2001 by Prentice Hall, Inc. , Upper Saddle River, N.J. 07458
Concepts of TQM • Continuous improvement • Employee empowerment • Benchmarking • Just-in-time (JIT) • Taguchi concepts • Knowledge of tools © 2001 by Prentice Hall, Inc. , Upper Saddle River, N.J. 07458
Continuous Improvement • Represents continual improvement of process & customer satisfaction • Involves all operations & work units • Other names • Kaizen (Japanese) • Zero-defects • Six sigma © 1984-1994 T/Maker Co. © 2001 by Prentice Hall, Inc. , Upper Saddle River, N.J. 07458
Shewhart’s PDCA Model 4.Act 1.Plan Identify the improvement and make a plan Implement the plan 2.Do 3.Check Is the plan working Test the plan © 2001 by Prentice Hall, Inc. , Upper Saddle River, N.J. 07458
Employee Empowerment • Getting employees involved in product & process improvements • 85% of quality problems are due to process & material • Techniques • Support workers • Let workers make decisions • Build teams & quality circles © 1995 Corel Corp. © 2001 by Prentice Hall, Inc. , Upper Saddle River, N.J. 07458
Benchmarking Selecting best practices to use as a standard for performance • Determine what to benchmark • Form a benchmark team • Identify benchmarking partners • Collect and analyze benchmarking information • Take action to match or exceed the benchmark © 2001 by Prentice Hall, Inc. , Upper Saddle River, N.J. 07458
Just-in-Time (JIT) Relationship to quality: • JIT cuts cost of quality • JIT improves quality • Better quality means less inventory and better, easier-to-employ JIT system © 2001 by Prentice Hall, Inc. , Upper Saddle River, N.J. 07458
Just-in-Time (JIT) • ‘Pull’ system of production/purchasing • Customer starts production with an order • Involves ‘vendor partnership programs’ to improve quality of purchased items • Reduces all inventory levels • Inventory hides process & material problems • Improves process & product quality © 2001 by Prentice Hall, Inc. , Upper Saddle River, N.J. 07458
Work in process inventory level(hides problems) Unreliable Vendors Capacity Imbalances Scrap Just-In-Time (JIT) Example © 2001 by Prentice Hall, Inc. , Upper Saddle River, N.J. 07458
Reducing inventory revealsproblems so they can be solved. Unreliable Vendors Capacity Imbalances Scrap Just-In-Time (JIT) Example © 2001 by Prentice Hall, Inc. , Upper Saddle River, N.J. 07458
Tools for TQM • Quality Function Deployment • House of Quality • Quality loss function • Pareto charts • Process charts • Cause-and-effect diagrams • Statistical process control • Poke-Yoke, (error proofing) © 2001 by Prentice Hall, Inc. , Upper Saddle River, N.J. 07458
Problem Too many defects Cause and Effect Diagram Example © 2001 by Prentice Hall, Inc. , Upper Saddle River, N.J. 07458
Cause and Effect Diagram Example Method Manpower Main Cause Too many defects Material Machinery Main Cause © 2001 by Prentice Hall, Inc. , Upper Saddle River, N.J. 07458
Cause and Effect Diagram Example Method Manpower Drill Over Time Too many defects Wood Steel Lathe Material Machinery Sub-Cause © 2001 by Prentice Hall, Inc. , Upper Saddle River, N.J. 07458
Tired Drill Over Slow Time Too many defects Old Wood Steel Lathe Cause and Effect Diagram Example Method Manpower Material Machinery © 2001 by Prentice Hall, Inc. , Upper Saddle River, N.J. 07458
Fishbone Chart - Problems with Airline Customer Service © 2001 by Prentice Hall, Inc. , Upper Saddle River, N.J. 07458