Download
1 / 71
1.53k likes | 3.53k Views
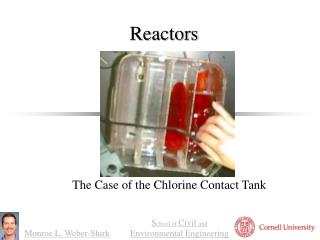
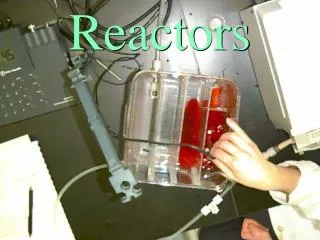
Residence Time Distribution for Chemical Reactors. 授課教師:林佳璋. General Characteristics. The two major uses of the residence time distribution to characterize nonideal reactors are 1. To diagnose problems of reactors in operation

E N D
General Characteristics The two major uses of the residence time distribution to characterize nonideal reactors are 1. To diagnose problems of reactors in operation 2. To predict conversion or effluent concentrations in existing/available reactors when a new reaction is used in the reactor. Three concepts were used to describe nonideal reactors: the distribution of residence times in the system, the quality of mixing and the model used to describe the system. Not all molecules are spending the same time in the reactor.
Residence-Time Distribution (RTD) Function ~The time the atoms have spent in the reactor is called the residence time of the atoms in the reactor. ~In any reactor, the distribution of residence times can significantly affect its performance. ~The residence-time distribution (RTD) of a reactor is a characteristic of the mixing that occurs in the chemical reactor. ~Not all RTDs are unique to a particular reactor type; markedly different reactors can display identical RTDs. ~The RTD exhibited by a given reactor type yields distinctive clues to the type of mixing occurring within it and is one of the most informative characterizations of the reactor.
Measurement of the RTD ~The RTD is determined experimentally by injecting an inert chemical, molecule, or atom, called a tracer, into the reactor at some time t=0 and then measuring the tracer concentration, C, in the effluent stream as a function of time. ~In addition to being a nonreactive species that is easily detectable, the tracer should have physical properties similar to those of the reacting mixture and be completely soluble in the mixture. ~It also should not adsorb on the walls or other surfaces in the reactor. The latter requirements are needed so that the tracer’s behavior will honestly reflect that of the material flowing through the reactor. ~Colored and radioactive materials along with inert gases are the most common types of tracers.
Pulse Input Experiment In a pulse input, an amount of tracer N0 is suddenly injected in one shot into the feedstream entering the reactor in as short a time as possible. We shall analyze the injection of a tracer pulse for a single-input and single-output system in which only flow carries the tracer material across system boundaries. First, we choose an increment of time t sufficiently small that the concentration of tracer, C(t), exiting between time t and t+t is essentially the same. The amount of tracer material, N, leaving the reactor between time t and t+t is then v is the effluent volumetric flow rate representing the fraction of material that have a residence time in the reactor between time t and t+t N is the amount of material exiting the reactor that has spent an amount of time between t and t+t in the reactor.
For pulse injection we define describing in a quantitative manner how much time different fluid elements have spent in the reactor residence-time distribution function The quantity E(t)dt is the fraction of fluid exiting the reactor that has spent between time t and t+dt inside the reactor.
Example 13-1 A sample of the tracer hytane at 320 K was injected as pulse to a reactor, and the effluent concentration was measured as a function of time, resulting in the data shown in Table E13-1.1. The measurement represent the exact concentrations at the times listed and not average values between the various sampling tests. (a) Construct figures showing C(t) and E(t) as functions of time. (b) Determine both the fraction of material leaving the reactor that has spent between 3 and 6 min in the reactor and the fraction of material leaving the reactor that has spent between 7.75 and 8.25 min in the reactor, and (c) determine the fraction of material leaving the reactor that has spent 3 min or less in the reactor.
Solution (a)
(b) We find that 51% of material leaving the reactor spends between 3 and 6 min in the reactor. We find that 3% of material leaving the reactor spends between 7.75 and 8.25 min in the reactor.
(c) area=0.20 We see that 20% of the material has spent 3 min or less in the reactor. We see that 80% of the material has spent 3 min or more in the reactor.
~The principal difficulties with the pulse technique lie in the problems connected with obtaining a reasonable pulse at a reactor’s entrance. ~The injection must take place over a period which is very short compared with residence times in various segments of the reactor or reactor system, and there must be a negligible amount of dispersion between the point of injection and the entrance to the reactor system. ~There are problems when the concentration-time curve has a long tail because the analysis can be subject to large inaccuracies. This problem principally affects the denominator of the right-hand side of the following equation It is desirable to extrapolate the tail and analytically continue the calculation. ~The tail of the curve may sometimes be approximated as an exponential decay. The inaccuracies introduced by this assumption are very like to be much less than those resulting from either truncation or numerical impression in this region.
Step Tracer Experiment The output concentration from a vessel is related to the input concentration by the convolution integral: pulse input step input constant volumetric rate cumulative distribution
~The positive step is usually easier to carry out experimentally than the pulse test, and it has the additional advantage that the total amount of tracer in the feed over the period of the test does not have to be known as it does in the pulse test. ~One possible drawback in this technique is that it is sometimes difficult to maintain a constant tracer concentration in the feed. ~Obtaining the RTD from this test also involves differentiation of the data and presents an additional and probable more serious drawback to the technique, because differentiation of data can, on occasion, lead to large errors. ~A third problem lies with the large amount of tracer required for this test. If the tracer is very expensive, a pulse test is almost always used to minimize the cost.
Characteristics of the RTD Sometimes E(t) is called the exit-age distribution function. If we regard the “age” of an atom as the time it has resided in the reaction environment, then E(t) concerns the age distribution of the effluent stream. It is the most used of the distribution function connected with reactor analysis because it characterizes the length of time various atoms spend at reaction conditions. Integral Relationships cumulative distribution function We can calculate F(t) at various times t from the area under the curve of an E(t) versus t plot.
~The F curve is another function that has been defined as the normalized response to a particular input. ~Alternatively, the following equation has been used as a definition of F(t), and it has been stated that as a result it can be obtained as the response to a positive-step tracer test. ~Sometimes the F curve is used in the same manner as the RTD in the modeling of chemical reactors.
Mean Residence Time We have a reactor completely filled with maize molecules. At time t=0 we start blue molecules to replace the maize molecules that currently fill the reactor. Initially, the reactor volume V is equal to the volume occupied by the maize molecules. Now, in a times dt, the volume of molecules that will leave the reactor is (vdt). The fraction of these molecules that have been in the reactor a time t or greater is [1-F(t)]. Because only the maize molecules have been in the reactor a time t or greater, the volume of maize molecules, dV, leaving the reactor in a time dt is volumetric flow is constant For liquid reactions, no change in volumetric flow rate. For gas reactions, no pressure drop, isothermal operation, and no change in the total number of moles (=0).
Other Moments of the RTD Variance or square of the standard deviation is defined as The magnitude of this moment is an indication of the “spread” of the distribution; the greater the value of this moment is, the greater a distribution’s spread will be. Skewness is defined as The magnitude of this moment measures the extent that a distribution is skewed in one direction or another in reference of the mean.
Example 13-2 Calculate the residence time and the variance for the reactor characterized in Example 13-1 by the RTD obtained from a pulse input at 320 K. Solution
Normalized RTD Function, E() If the parameter is defined as The quantity represents the number of reactor volumes of fluid based on entrance conditions that have flowed through the reaction in time t. a dimensionless function E() can be defined as The purpose of creating this normalized distribution is that the flow performance inside reactors of different sizes can be compared directly. ~If the normalized function E() is used, all perfectly mixed CSTRs have numerically the same RTD. ~If the simple function E(t) is used, numerical values of E(t) can differ substantially for different CSTRs.
Internal-Age Distribution, I() ~I() is the fraction of material inside the reactor that has been inside the reactor for a period of time between and +. ~E() is the fraction of material leaving the reactor that has spent for a time between and +in the reactor. For a CSTR,
RTD in Ideal Reactors RTD in Batch and Plug-Flow Reactors All the atoms leaving such reactors have spent precisely the same amount of time within the reactors. The distribution function in such a case is a spike of infinite height and zero width, whose area is equal to 1; the spike occurs at t=V/v=, or =1. All material spends exactly a time in the reactor, there is no variance!
Single-CSTR RTD A material balance on an inert tracer that has been injected as a pulse at time t=0 into a CSTR yields for t>0 Because the reactor is perfectly mixed, C in this equation is the concentration of the tracer either in the effluent or within the reactor.
Laminar Flow Reactor (LFR) For laminar flow in a tubular reactor, the velocity profile is parabolic, with the fluid in the center of the tube spending the shorter time in the reactor. A schematic diagram of the fluid movement after a time t is shown in Figure 13-8. The figure at the left shows how far down the reactor each concentric fluid element has traveled after a time t. Umax is the centerline velocity Uavg is the average velocity through the tube. Uavg is the volumetric flow rate divided by the cross-sectional area. The time of passage of an element of fluid at a radius r is
The volumetric flow rate of fluid out between r and r+dr, dv, is The fraction of total fluid passing between r and r+dr, dv/v0, is
Diagnostics and Troubleshooting General Comments Figure 13-10(a) and (b) correspond to nearly ideal PFRs and CSTRs, respectively. Figure 13-10(d) shows that a principal peak occurs at a time smaller than the space time (=V/v0) (i.e. early exit of fluid) and also that some fluid exits at a time greater than space-time . This curve could be representative of the RTD for a packed-bed reactor with channeling and dead zones shown in Figure 13-10(c). Figure 13-10(f) shows the RTD for the nonideal CSTR in Figure 13-10(e), which has dead zones and bypassing. The dead zone serves to reduce the effective reactor volume, so the active reactor volume is smaller than expected.
Simple Diagnostics and Troubleshooting Using the RTD for Ideal Reactors CSTR Perfect Operation (P) If is large, there will be a slow decay of the output transient, C(t), and E(t) for a pulse input. If is small, there will be rapid decay of the transient, C(t), and E(t) for a pulse input.
Bypassing (BP) v0 is the total volumetric flow rate vSB is the volumetric flow rate entering the system volume vb is the volumetric flow rate bypassing the reactor The space time, SB, will be greater than that if there were no bypassing. Because SB is greater than there will be a slower decay of the transients C(t) and E(t) than of perfect operation. Having an initial jump equal to the fraction by-passed.
Dead Volume (DV) V is the total volume VD is the dead volume VSD is the system volume The transients C(t) and E(t) will decay more rapidly than that for perfect operation because there is a smaller system volume.
PFR Perfect Operation (P) Bypassing (BP) Dead Volume (DV)
PFR/CSTR Series RTD The reacting mixture may follow a somewhat tortuous path either before entering or after leaving the perfectly mixed zone-or even both. This tortuous path may be modeled as a plug-flow reactor. Thus this type of tank reactor may be modeled as a CSTR in series with a plug-flow reactor, and the PFR may either precede or follow the CSTR. s is the residence time in the CSTR p is the residence time in the PFR The output will be delayed by a time p at the outlet of the plug-flow section If the pulse of tracer is introduced into the entrance of the plug-flow section, then the same pulse will appear at the entrance of the perfectly mixed section p seconds later. PFR+CSTR
Example 13-3 Consider a second-order being carried out in a real CSTR that can be modeled as two different reactor systems: In the first system an ideal CSTR is followed by an ideal PFR; in the second system the PFR precedes the CSTR. Let s and p each equal 1 min, let the reaction rate constant equal 1.0 m3/kmolmin, and let the initial concentration of liquid reactant, CA0, equal 1 kmol/m3. Find the conversion in each system. Solution A mole balance on the CSTR section gives A mole balance on the PFR section gives
The conclusions from this example are of extreme importance in reactor analysis: ~The RTD is not a complete description of structure for a particular reactor or system of reactors. ~The RTD is unique for a particular reactor, however, the reactor or reaction system is not unique for a particular RTD. ~In addition to the RTD, an adequate model of the nonideal reactor flow pattern and knowledge of the quality of mixing or “degree of segregation” are both required to characterize a reactor properly.
Reactor Modeling Using the RTD RTD Model Kinetic Data Exit Concentration Exit Conversion RTD tells us how long the various fluid elements have been in the reactor, but it does not tell us anything about the exchange of matter between the fluid elements (i.e., the mixing). For reactions other than first order, the degree of mixing of molecules must be known in addition to how long each molecule spends in the reactor. The conversion is independent of concentration
~Macromixing produces a distribution of residence times without specifying how molecules of different ages encounter one another in the reactor. ~Micromixing describes how molecules of different ages encounter one another in the reactor. ~Complete segregation: all molecules of the same age group remain together as they travel through the reactor and are not mixed with any other age until they exit the reactor. ~Complete micromixing: molecules of different age groups are completely mixed at the molecular level as soon as they enter the reactor. For a given sate of macromixing (i.e., a given RTD), these two extremes of micromixing will give the upper and lower limits on conversion in a nonideal reactor. For reaction orders greater than one or less than zero, the segregation model will predict the highest conversion. For reaction orders between zero and one, the maximum mixedness model will predict the highest conversion.
A fluid in which the globules of a given age do not mix with other globules is called a macrofluid. A macrofluid could be visualized as noncoalescent globules where all the molecules in a given globule have the same age. late mixing ~ complete segregation early mixing ~ maximum mixedness A fluid in which molecules are not constrained to remain in the globule and are free to move everywhere is called a microfluid.
Zero-Parameter Models Segregation Model If fluid elements of different ages do not mix together at all, the elements remain segregated from each other, and the fluid is termed completely segregated. In the segregated flow model we visualize the flow though the reactor to consist of a continuous series of globules (Figure 13-22). These globules retain their identity; that is, they do not interchange material with other globules in the fluid during their period of residence in the reaction environment, i.e., they remain segregated. In addition, each globule spends a different amount of time in the reactor. What we are doing is lumping all the molecules that have exactly the same residence time in the reactor into the same globules.
Because the fluid flows down the reactor in plug flow, each exit stream corresponds to a specific residence time in the reactor. Batches of molecules are removed from the reactor at different locations along the reactor in such a manner as to duplicate the RTD function, E(t). The molecules removed near the entrance to the reactor correspond to those molecules having short residence times in the reactor. This effluent would correspond to the molecules that channel rapidly through the reactor. The farther the molecules travel along the reactor before being removed, the longer their residence time. The points at which the various groups or batches of molecules are removed correspond to the RTD function for the reactor.
Because there is no molecular interchange between globules, each acts essentially as its own batch reactor. The reaction time in any one of these tiny batch reactors is equal to the time that the particular globules spends in the reaction environment. If we have the RTD, the reaction rate expression, then for a segregated flow situation (i.e., model), we have sufficient information to calculate the conversion.
Example 13-4 Derive the equation of a first-order reaction using the segregation model when the RTD is equivalent to (a) an ideal PFR, (b) an ideal CSTR, and (c) a laminar flow reactor. Compare these conversions with those obtained from the design equation. Solution (a) PFR (b) CSTR
For large values of Damkohler number then, there is complete conversion along the streamlines off the center streamline so that the conversion is determined along the pipe axis such that
~We have just shown for a first-order reaction that whether you assume complete micromixing or complete segregation in a CSTR, the same conversion results. ~This phenomenon occurs because the rate of change of conversion for a first-order does not depend on the concentration of the reacting molecules; it does not matter what kind of molecule is next to it or colliding with it. ~The extent of micromixing does not affect a first-order reaction, so the segregation flow model can be used to calculate the conversion. ~Only the RTD is necessary to calculate the conversion for a first-order reaction in any type of reactor. ~Knowledge of neither the degree of micromixing nor the reactor flow pattern is necessary.
Example 13-5 Calculate the mean conversion in the reactor we have characterized by RTD measurements in Examples 13-1 and 13-2 for a first-order, liquid-phase, irreversible reaction in a completely segregated fluid: Aproducts The specific reaction rate is 0.1 min-1 at 320 K. Solution Because each globule acts as a batch reactor of constant volume, we use the batch reactor design equation to arrive at the equation giving conversion as a function of time:
As discussed previously, because the reaction is first order, the calculated conversion would be valid for a reactor with complete mixing, complete segregation, or any degree of mixing between the two. Although early mixing or late mixing does not affect a first-order reaction, micromixing or complete segregation can modify the results of a second-order system significantly.
Example 13-6 The liquid-phase reaction between cytidine and acetic anhydride A+BC+D is carried out isothermally in an inert solution of N-methyl-2-pyrrolidine (NMP) with NMP=28.9. The reaction follows an elementary rate law. The feed is equal molar in A and B with CA0=0.75 mol/dm3, a volumetric flow rate of 0.1 dm3/s and a reactor volume of 100 dm3. Calculate the conversion in (a) a PFR, (b) a batch reactor, and (c) a laminar flow reactor. Additional information