Download
1 / 24
240 likes | 482 Views
Kimberlee Texter Erie 2 Chautauqua – Cattaraugus BOCES ktexter@e2ccb.org. Creating Benchmark Assessments in Elementary Mathematics. Frewsburg CSD: 930 students K-12 Sherman CSD: 485 students K-12 Dunkirk CSD: 2,027 students K-12. Where are we doing this?.

E N D
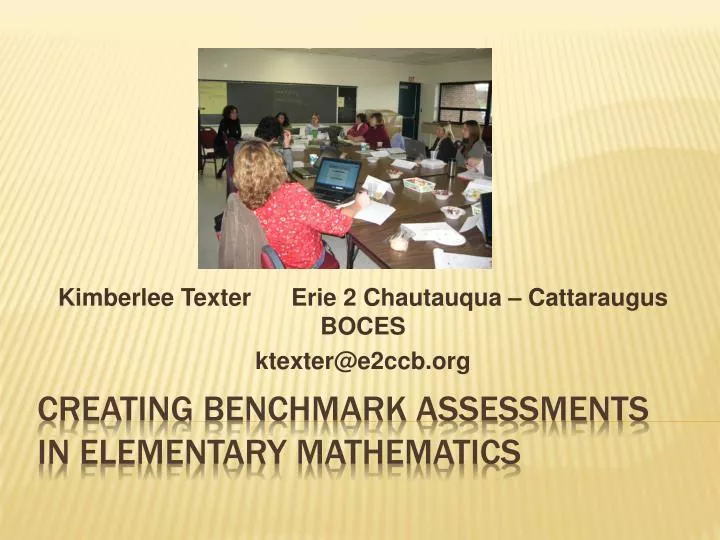
Kimberlee Texter Erie 2 Chautauqua – Cattaraugus BOCES ktexter@e2ccb.org Creating Benchmark Assessments in Elementary Mathematics
Frewsburg CSD: 930 students K-12 Sherman CSD: 485 students K-12 Dunkirk CSD: 2,027 students K-12 Where are we doing this?
Creating 3 or 4 benchmark assessments that all students take that are formative. Using this information to recommend entering or exiting AIS. Pre-testing skills to be taught throughout the year. What are we doing?
Give students the information about what skills they need help with and what goals to set for themselves. Target specific gaps in skills. Allocate an appropriate amount of time for each skill. Why are we doing this?
Teachers needed additional assessment data to help make decisions about AIS, RTI, and curriculum. • AIMS web was not addressing all of their needs when prescribing interventions. • Felt like students were being “overlooked” by the state test or were “trapped” in AIS for a whole year. Why are we doing this?
Teachers are looking at their data from state tests. They use trends and gaps to make decisions about what PIs they want to assess. How are we doing this? District Region Possible points
After having conversations with the teachers above and below their grade level, the teacher decides on the skills that are imperative for students to have at each grade level. How are we doing this?
Next, they looked at their curriculum to see when each of the different PIs are address throughout the year. When creating the test, they will make sure the PI is same item number on each of the benchmark tests. 3.N.15: Post 3rd Grade PI: Compare and order unit fractions and find their approximate location on a number line. How are we doing this?
Following that decision, they then decided how many tests to give and how many items would be on each test. For example, the fourth grade teachers decided they were giving 4 tests and they would be introducing 6 new items per test. Test #1 Test #2 Test #3 Test #4 1-6 7-12 13-18 19-24 How are we doing this?
Tests in September, November, March, and June The first 6 questions would be post 3rd grade skills. Items 7-12 would be beginning of 4th grade skills. Items 13-18 would be mid-year 4th grade skills. Items 19-24 would be end of the year skills. How are we doing this?
Each test gets “meatier” as the year goes on. When a child misses a question, the teacher meets with the child to see if it is a content problem or a problem with the question. If it is a content problem, Tier 1 interventions are implemented. The AIS teacher is also informed. How are we doing this?
If AIS is recommended, the provider focuses on the specific skills the student got wrong with on the benchmark assessment. After 10 weeks, the AIS provider gives the student a mini assessment with only the skill the student was struggling with being tested. If the student does well, they are released from AIS. If they are still having trouble they remain. How are we doing this?
The student is monitored in class and on future benchmark assessments to see if they have attained the skill. If all of the students do well on a question, the teacher should adjust the amount of time spent on that PI or make the lessons more rigorous. How are we Doing this?
4th Grade Test A 3.N.15: Post Third Grade Performance Indicator: Compare and order unit fractions (1/2, 1/3, 1/4) and find their approximate locations on a number line.
4th Grade Test b 3.N.15: Post Third Grade Performance Indicator: Compare and order unit fractions (1/2, 1/3, 1/4) and find their approximate locations on a number line.
4th Grade Test c 3.N.15: Post Third Grade Performance Indicator: Compare and order unit fractions (1/2, 1/3, 1/4) and find their approximate locations on a number line.
4th Grade Test d 3.N.15: Post Third Grade Performance Indicator: Compare and order unit fractions (1/2, 1/3, 1/4) and find their approximate locations on a number line.
5th Grade Example District Region Possible points
5th Grade Test A 5.A.7 - Create and explain patterns and algebraic relationships and functions (e.g.,2,4,6,8...) algebraically for example: 2n (doubling)
5th Grade Test B 5.A.7 - Create and explain patterns and algebraic relationships and functions (e.g.,2,4,6,8...) algebraically for example: 2n (doubling)
5th Grade Test c 5.A.7 - Create and explain patterns and algebraic relationships and functions (e.g.,2,4,6,8...) algebraically for example: 2n (doubling)
5th Grade Test D 5.A.7 - Create and explain patterns and algebraic relationships and functions (e.g.,2,4,6,8...) algebraically for example: 2n (doubling)
Create student self-monitoring documents where they can set goals and see their areas of strength and weakness. ELA Benchmarks Continue to look at the data and see if there are new PIs that should be included on the assessment. What’s Next?
Questions/Comments Thank you!!!