Download
1 / 16
160 likes | 224 Views
How do we evaluate computer architectures?. Think of 5 characteristics that differentiate computers? Can some processors compute things that others can’t?. How do we evaluate computer architectures?. Think of 5 characteristics that differentiate computers?. Two notions of performance.

E N D
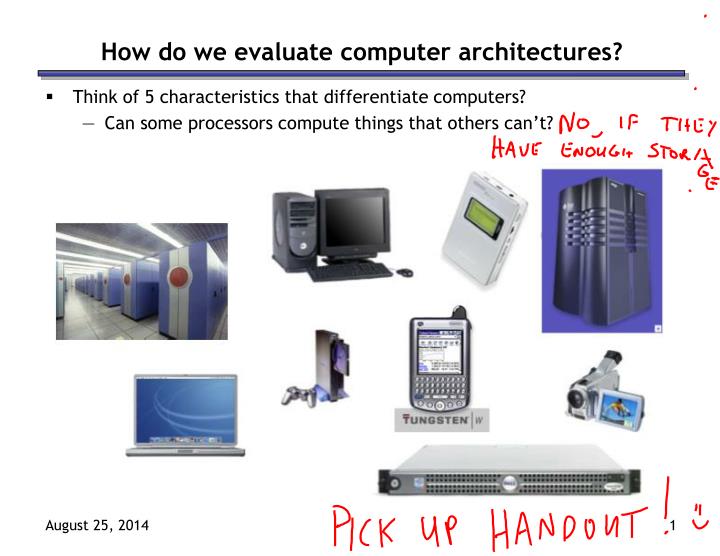
How do we evaluate computer architectures? • Think of 5 characteristics that differentiate computers? • Can some processors compute things that others can’t?
How do we evaluate computer architectures? • Think of 5 characteristics that differentiate computers?
Two notions of performance • Which has higher performance? • From a passenger’s viewpoint: latency (time to do the task) • hours per flight, execution time, response time • From an airline’s viewpoint: throughput (tasks per unit time) • passengers per hour, bandwidth • Latency and throughput are often in opposition
Some Definitions • Relative performance: “x is N times faster than y” Performance(x) Performance(y) • If we are primarily concerned with latency, Performance(x) = 1 Latency(x) • If we are primarily concerned with throughput, Performance(x) = throughput(x) = N
CPU performance • The obvious metric: how long does it take to run a test program? This depends upon three factors: • The number of dynamic instructions N in the program • Executing more instructions tends to take longer. • The kind of instructions in the program • Some instructions take more CPU cycles than others • Let c be the average number of cycles per instruction (CPI) • The time t per CPU clock cycle (clock-cycle time) CPU time = Instructions executed CPI Clock cycle time
The three components of CPU performance • Instructions executed: • the dynamic instruction count (#instructions actually executed) • not the (static) number of lines of code • Average Cycles per instruction: • function of the machine and program • CPI(floating-point operations) CPI(integer operations) • Improved processor may execute same instructions in fewer cycles • Single-cycle machine: each instruction takes 1 cycle (CPI = 1) • CPI can be 1 due to memory stalls and slow instructions • CPI can be 1 on superscalar machines • Clock cycle time: 1 cycle = minimum time it takes the CPU to do any work • clock cycle time = 1/ clock frequency • 500MHz processor has a cycle time of 2ns (nanoseconds) • 2GHz (2000MHz) CPU has a cycle time of just 0.5ns • higher frequency is usually better
Execution time, again CPU time = Instructions executed CPI Clock cycle time • Make things faster by making any component smaller! • Often easy to reduce one component by increasing another
Performance Optimization • Until you are an expert, first write a working version of the program • Then, and only then, begin tuning, first collecting data, and iterate • Otherwise, you will likely optimize what doesn’t matter “We should forget about small efficiencies, say about 97% of the time: premature optimization is the root of all evil.” -- Sir Tony Hoare ISA's, Compilers, and Assembly
Building a benchmark • You need something to gauge your progress. • Should be representative of how the program will be used ISA's, Compilers, and Assembly
Instrumenting your program • We can do this by hand. Consider: test.c --> test2.c • Let’s us know where the program is spending its time. • But implementing it is tedious; consider instrumenting 130k lines of code ISA's, Compilers, and Assembly
Using tools to do instrumentation • Two GNU tools integrated into the GCC C compiler • Gprof: The GNU profiler • Compile with the -pg flag • This flag causes gcc to keep track of which pieces of source code correspond to which chunks of object code and links in a profiling signal handler. • Run as normal; program requests the operating system to periodically send it signals; the signal handler records what instruction was executing when the signal was received in a file called gmon.out • Display results using gprof command • Shows how much time is being spent in each function. • Shows the calling context (the path of function calls) to the hot spot. ISA's, Compilers, and Assembly
Example gprof output Each sample counts as 0.01 seconds. % cumulative self self total time seconds seconds calls s/call s/call name 81.89 4.16 4.16 37913758 0.00 0.00 cache_access 16.14 4.98 0.82 1 0.82 5.08 sim_main 1.38 5.05 0.07 6254582 0.00 0.00 update_way_list 0.59 5.08 0.03 1428644 0.00 0.00 dl1_access_fn 0.00 5.08 0.00 711226 0.00 0.00 dl2_access_fn 0.00 5.08 0.00 256830 0.00 0.00 yylex Over 80% of time spent in one function Provides calling context (main calls sim_main calls cache_access) of hot spot index % time self children called name 0.82 4.26 1/1 main [2] [1] 100.0 0.82 4.26 1 sim_main [1] 4.18 0.07 36418454/36484188 cache_access <cycle 1> [4] 0.00 0.01 10/10 sys_syscall [9] 0.00 0.00 2935/2967 mem_translate [16] 0.00 0.00 2794/2824 mem_newpage [18] ISA's, Compilers, and Assembly
Using tools for instrumentation (cont.) • Gprof didn’t give us information on where in the function we were spending time. (cache_access is a big function; still needle in haystack) • Gcov: the GNU coverage tool • Compile/link with the -fprofile-arcs -ftest-coverage options • Adds code during compilation to add counters to every control flow edge (much like our by hand instrumentation) to compute how frequently each block of code gets executed. • Run as normal • For each xyz.c file an xyz.gdna and xyz.gcno file are generated • Post-process with gcov xyz.c • Computes execution frequency of each line of code • Marks with ##### any lines not executed • Useful for making sure that you tested your whole program ISA's, Compilers, and Assembly
Example gcov output Code never executed 14282656: 540: if (cp->hsize) { #####: 541: int hindex = CACHE_HASH(cp, tag); -: 542: #####: 543: for (blk=cp->sets[set].hash[hindex]; -: 544: blk; -: 545: blk=blk->hash_next) -: 546: { #####: 547: if (blk->tag == tag && (blk->status & CACHE_BLK_VALID)) #####: 548: goto cache_hit; -: 549: } -: 550: } else { -: 551: /* linear search the way list */ 753030193: 552: for (blk=cp->sets[set].way_head; -: 553: blk; -: 554: blk=blk->way_next) { 751950759: 555: if (blk->tag == tag && (blk->status & CACHE_BLK_VALID)) 738747537: 556: goto cache_hit; -: 557: } -: 558: } Loop executed over 50 interations on average (751950759/14282656) ISA's, Compilers, and Assembly
Conclusion • The second step to making a fast program is finding out why it is slow • The first step is making a working program • Your intuition where it is slow is probably wrong • So don’t guess, collect data! • Many tools already exist for automatically instrumenting your code • Identify the “hot spots” in your code where time is being spent • Two example tools: • Gprof: periodically interrupts program • Gcov: inserts counters into code • We’ll see Vtune in section, which explains why the code is slow • If you’ve never tuned your program, there is probably “low hanging fruit” • Most of the time is spent in one or two functions • Try using better data structures (225) or algorithms (473) to speed these up ISA's, Compilers, and Assembly
The Design Process Key Idea: Iterative Refinement • Build simplest possible implementation • Does it meet criteria? If so, stop. Else, what can be improved? • Generate ideas on how to improve it • Select best ideas, based on benefit/cost • Modify implementation based on best ideas • Goto step 2. It is very tempting to go straight to an “optimized” solution. Pitfalls: • You never get anything working • Incomplete problem knowledge leads to selection of wrong optimizations With iterative refinement, you can stop at any time! Result is optimal for time invested. Understand Requirements Implement Evaluate/ Analyze Prioritize/ Select Brainstorm ISA's, Compilers, and Assembly