Download
1 / 18
180 likes | 421 Views
Introduction to Lean Six Sigma 05/02/2013. Agenda. Intro to Six Sigma Intro to Lean Putting it all together: Lean Six Sigma and the DMAIC approach Application to Clinical Research Services Questions. What Is Six Sigma?.

E N D
Agenda • Intro to Six Sigma • Intro to Lean • Putting it all together: Lean Six Sigma and the DMAIC approach • Application to Clinical Research Services • Questions
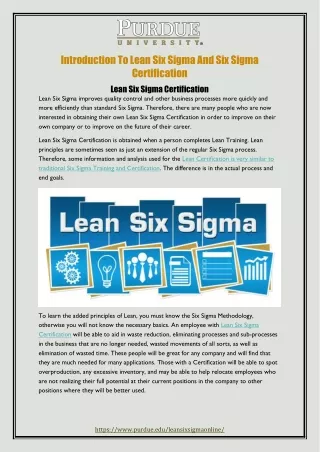
What Is Six Sigma? • A statistical measure for determining process capability (Six Sigma Quality level equates to 3.4 defects per million opportunities) • A proven set of tools and tactics for reducing variation • A successful business strategy (in use by GE, Motorola, Texas Instruments, Eli Lilly, Roche, Bank of America and Allied Signal) • A comprehensive philosophy about operational excellence • A complementary discipline to existing tools Focus on Customer Satisfaction, Improving ProcessCapabilities, and Organization-wide Involvement
Process Capability and Defects Sigma Quality Level DPMO Yield 2 3 4 5 6 69.2% 93.3% 99.4% 99.97% 99.9996% 308,537 66,807 6,210 233 3.4 ProcessCapability Defects Per Million Opportunities
Why 99% Is Not Good Enough • The “goodness level” of 99% equates to: • 20,000 lost articles of mail per hour • Unsafe drinking water almost 15 minutes each day • 5,000 incorrect surgical operations per week • 2 short or long landings at most major airports each day • 200,000 wrong drug prescriptions each year • No electricity for almost 7 hours per month
Lean Six Sigma – People, Process, Technology • “Eighty-five percent of the reasons for failure to meet customer expectations are related to deficiencies in systems and process… rather than the employee. The role of management is to change the process rather than badgering individuals to do better.” DrDemming • Democracy in planning, autocracy in execution! • The ultimate goal is to set self-managed teams to empower decision-making at the lowest possible level • Start by understanding and improving the process, then develop the right technology to enable the process – not the other way around! (Epic anyone?)
Origins of JIT and Lean Production • Pioneered by Toyota based on US practices • Adopted by other Japanese manufacturers • Utilized much later by Western manufacturers • Known by many names: • Toyota Production System • Just-In-Time production • Flow production • Systems viewpoint • Waste focused
Eight Wastes • Waste in Transportation • Waste of Inventory • Waste of Motion • Waste of Waiting (Idle Time) • Waste of Over Production • Waste of Over Processing • Waste of Defects/Rework • Waste of not listening to people idea’s!
Today’s Environment… Too Many Hand-Offs Not Enough Information Too Much Rework Manually Intensive Missing Customer CTQs Long Cycle Times Where We Need to Be... Reduced Complexity Timely Information Doing It Right the First Time Improved Systems Satisfied Customers Shorter Cycle Times The Synergy of Lean and Six Sigma
Lean Six Sigma Combines the strategy and solution sets inherent in Lean with the cultural, organizational process and analytical tools of Six Sigma. With the result that we … respond to our customers better, faster with less waste Six Sigma Lean
Lean/6 Sigma – Highlevel Project Plan Define Define Measure Measure Analyze Analyze Improve Improve Control Control People Process Technology F(x) = Y Improve Key Deliverables: • Proposed Solutions & Endorsement • Improvement Forecasted Benefits • Pilot and Implement Control Key Deliverables: • Sustainability Plan • Team Evaluation • Replication & Standardization Opportunities • Actual $$ Saving Define Key Deliverables: • Project Charter • Roles and Responsibilities • Process Mapping (i.e. SIPOCs) • Voice of Customer/Business (VOC/VOB) Measure Key Deliverables: • What data to collect • How to collect data • Measuring Data Accuracy and Precision Analyze Key Deliverables: • Data Analysis using statistical and lean methodologies
CRS Process Overview Define Define Measure Measure Analyze Analyze Improve Improve Control Control Clinical Research Services (CRS) Process On Deck Nursing Core On Deck Participant Recruitment Core PI Request CRS Services CRS Services Completed Protocol Approval On Deck Sampling Lab Core On Deck Body Composition & Exercise Core On Deck Study Coordinator Core On Deck Bio-nutrient Core 1 2 3 4 5 6 7
CIP#2. New Study Protocol Approval CHR & CRS Review Committees Define Define Measure Measure Analyze Analyze Improve Improve Control Control 7 Areas for improvements were identified Presentation to medical directors is scheduled for 7/26 to discuss finding and strategizing next steps
CIP#4. Enhancing Reservation and Scheduling Define Define Measure Measure Analyze Analyze Improve Improve Control Control Paper Form Electronic Form http://redcap.ucsfopenresearch.org/surveys/?s=m3LBRw Some Potential Benefits: • Decentralizing the reservation submission process – ability to access and submit remotely • Expediting the request process and streamlining the downstream scheduling
CIP#5. Measuring Utilization and Capacity of CRS Services at All Sites Define Define Measure Measure Analyze Analyze Improve Improve Control Control Use historical and newly collected data based on availability and accuracy Perform analysis to drive data-based decision to: dissolve bottlenecks increase throughput with current resource volume
CIP#7. Standardizing Service Agreements for CRS Services Define Define Measure Measure Analyze Analyze Improve Improve Control Control Benefits: Defining Service Expectations from PI and the requested CRS Services Ensuring agreement on responsibilities before and after the completion of service Signatures for confirmation
Acknowledgments CRS Staff: • Lynda Jacobsen • Eunice Stephens • Kathy Burkart • Cathleen Tierney • Mario Moreno • Leslie Mullin • Sindy Law • Sarah Lange • Elia Gonzales • Wendy Staub • Deanna Sheeley • Laura Kwong CHR Staff: • John Heldens • Liz Tioupine Sponsors • Bill Balke • Fabrice Beretta CTSI Leadership