Download
1 / 36
360 likes | 455 Views
ITW2007. Detection of Vertical Resonance Modes of Acoustic Waves and Its Confirmation With Geomagnetic Field Measurement.

E N D
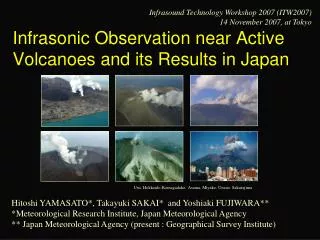
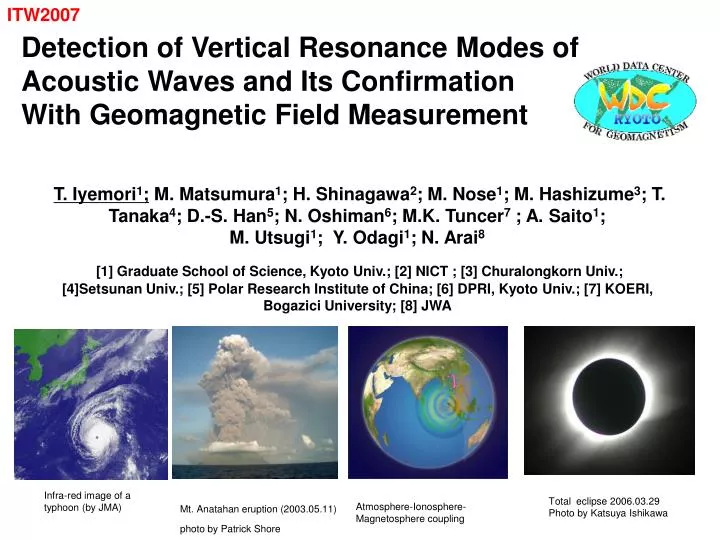
ITW2007 Detection of Vertical Resonance Modes of Acoustic Waves and Its Confirmation With Geomagnetic Field Measurement T. Iyemori1; M. Matsumura1; H. Shinagawa2; M. Nose1; M. Hashizume3; T. Tanaka4; D.-S. Han5; N. Oshiman6;M.K. Tuncer7 ; A. Saito1; M. Utsugi1; Y. Odagi1; N. Arai8 [1] Graduate School of Science, Kyoto Univ.; [2] NICT ; [3] Churalongkorn Univ.;[4]Setsunan Univ.; [5] Polar Research Institute of China; [6] DPRI, Kyoto Univ.; [7] KOERI, Bogazici University; [8] JWA Infra-red image of a typhoon (by JMA) Total eclipse 2006.03.29Photo by Katsuya Ishikawa Atmosphere-Ionosphere-Magnetosphere coupling Mt. Anatahan eruption (2003.05.11) photo by Patrick Shore
Inikli Barometric Observation Tbilisi Urumqi Installed Kyoto ▲ Inchuan △ To be Installed ▲ Kashi Aso Phimai Magnetometer only ▲ Alibag Magnetometer planning △
Sumatra earthquake caused lower atmospheric disturbances, which generate geomagnetic pulsations through acoustic wave resonance between the Earth's surface and thermosphere (i.e., ionospheric dynamo by the vertical wind.) To confirm this scenario, we have made comparative observation with barometer and magnetometer Vertical Wind Ionospheric Dynamo J=σVxB geomagnetic pulsation Ionosphere nT 01:00 02:00 Geomagnetic pulsation at Sumatra Earthquake.(Iyemori et al., GRL, 2005)
Dispersion diagram of acoustic gravity waves Acoustic wave (4~5 minutes) Acoustic cutoff frequency Brunt-Vaisala frequency Internal gravity wave (Kanamori, 2004)
Wave reflection at cutoff frequency Phase velocity Fast Vph Slow Altitude (km) Resonance between ground and ionospheric height Acoustic cutoff frequency ωa: ωa=γg/2c C2 = γRT Period (min.) Vertical resonance
Principal modes of acoustic resonance 200km 100km 0km 270sec=4.5min 229sec=3.8min 196sec=3.3min (K. Nishida, 2000)
Oscillations in the ionosphere excited at Sumatra earthquake “TEC Pulsation” GPS TEC data 01:12UT Earthquake Magnetic Pulsation Magnetic data Resonance peak at a period of 3.6min.
Two dimensional simulation of acoustic wave resonance in realistic atmosphere with geomagnetic field 3 resonance modes at 120km (ionosphere) Shinagawa et al. (EPS, 2007)
Mt. Pinatubo eruption 3 major resonance frequency 3.7-3.8 mHz (4.4-4.5 min., 260-270 sec.) 4.4-4.6 mHz (3.6-3.8 min., 210-230 sec.) 5.0-5.1 mHz (3.2-3.3 min., 190-200 sec.) 3.7 min Geomagnetic pulsation at Mt. Pinatubo eruption. Other cases Total eclipse on March 29, 2006 Total eclipse Inicli (Turkey), Urumqi (China) and Aso (Japan) 4.4min • How about pressure? • Same frequency ? • Cases of typhoon ?
Our Barometric Observation Sites (Geomagnetic data are also available at Aso and Shigaraki) Mineyama ▲ Kyoto Uji Shigaraki Sensor of barometer (VAISALA PTB210) 0.01hPa (0.0025hPa A/D) DC ~ 1Hz 1 sec recording (499Hz sampling) Aso ~500km Magnetometer only ▲
Typhoon No.14 Pressure at SGA and Mag-D at Aso (11-12LT) Mag-D at ASO Pressure at SGA Period (min.)
Typhoon No.14Pressure at Shigaraki and Mag-H at Aso (12-13LT) Mag-H at Aso Pressure at SGA 周期(分)
Typhoon No.14Pressure at SGA and Mag-D at ASO (14-15LT) Mag-D at ASO Pressure at SGA Period (min)
Typhoon No.14 Pressure at SGA and Mag-H at Aso (15.5-16.5LT) Mag-H at ASO Pressure at SGA
A comparison of barometric oscillation at Uji,Shigaraki and Isumi Power spectra High-pass filtered data 11:00 Local Time 14:00 Period (minutes) UjiShigarakiIsumi
A comparison after an Earthquake near Shigaraki, Japan Pressure at Shigaraki Mag.(D) at Aso Pressure at Aso Shigaraki is close to epicenter (~30km) and amplitude of pressure oscillation is large. (Origin time=12:19LT, M=5)
SUMMARY (1) • Spectral peaks in both pressure and geomagnetic fields at acoustic resonant frequencies (3 – 4 minutes) often appear and agree with theoretical prediction. • Lower atmosphere – ionosphere coupling • Confirmation of “acoustic resonance” • 2.Spectral peaks of pressure and those of magnetic field often coincide even if they apart more than 500km. They are intermittent and the peak frequency varies. • Magnetic oscillation (i.e., ionospheric current) is coherent in wider area because of its electro-magnetic nature ? • Many independent sources of resonance exist?
Ionospheric current Dynamo Electric field Magnetic oscillation could be more uniform than that of pressure Investigation of acoustic resonance with geomagnetic data
SUMMARY (2) 3. The acoustic resonance and generation of magnetic pulsation through ionospheric dynamo seem to be a rather common phenomenon. 4. Not only the acoustic resonance but also atmospheric internal gravity waves at lower frequencies (5-7 minutes) seem to cause geomagnetic pulsations. But having no specific (i.e., “resonant”) frequency. 5. A possible route of energy transfer from lower atmospheric disturbances to plasma space through ionospheric dynamo. (J=σVxB dynamo E, J ExB drift, JxB force, Joule heating, etc. ) 6. Micro-barometric observation and magnetic observation seem to be a beneficial combination each other in both scientific and practical (i.e. observational) sense.
Lower atmosphere Space ? Onset of another Pulsation (01:11UT) Tong Hai
Basic characteristics of micro-barometric variations Barometric Oscillation = Local turbulence + Acoustic wave (resonance) + Gravity wave Geomagnetic Oscillation = Geomagnetic pulsation (magnetospheric origin) + Ionospheric dynamocurrent (oscillation) How to detect these minor components?
GPS-TEC Pulsation after the Earthquake on Dec. 26, 2004 01:00 02:00 03:00 04:00 Universal Time (hour)
A comparison after an Earthquake near Shigaraki, Japan Pressure at Shigaraki Mag.(D) at Aso Pressure at Aso Shigaraki is close to epicenter (~30km) and amplitude of pressure oscillation is large. (Origin time=12:19LT, M=5)
タイ・ピマーイ 磁場観測 スマトラ沖地震 0 2 4 6 8 Universal Time 地震発生時刻
地震発生直前 1時間後 (02UT) 2時間後 3時間後 4時間後 5時間後
Location and Sensor of barometer Kyoto Univ. DPRI Shigaraki
ACE Solar wind data (9/21-9/23) and AE indices (9/22) Very low geomagnetic activity throughout the day
A case of Typhoon (2006.09.22) Barometric oscillation at Shigaraki Magnetic oscillation at Aso (D-comp.)
Mag-H at ASO Pressure at SGA Pressure at ASO