Download
1 / 22
220 likes | 370 Views
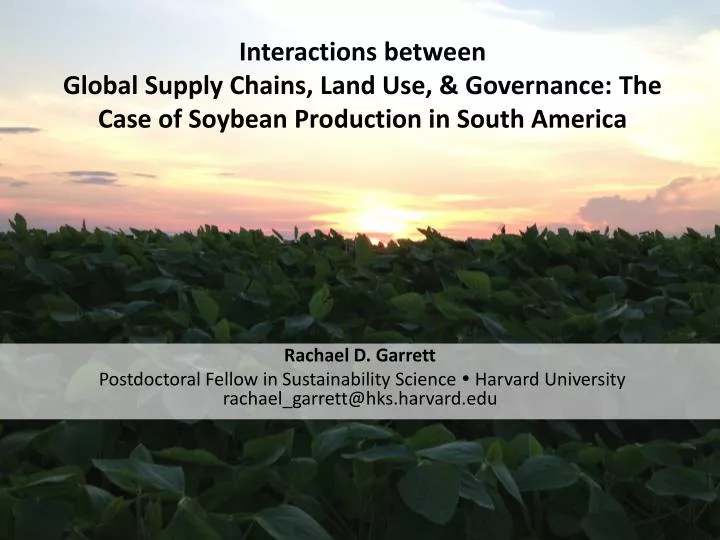
Interactions between Global Supply Chains, Land Use, & Governance: The Case of Soybean Production in South America. Rachael D. Garrett Postdoctoral Fellow in Sustainability Science Harvard University rachael_garrett@hks.harvard.edu.

E N D
Interactions between Global Supply Chains, Land Use, & Governance: The Case of Soybean Production in South America Rachael D. Garrett Postdoctoral Fellow in Sustainability Science HarvardUniversity rachael_garrett@hks.harvard.edu
Population& income growth & urbanization are increasing demand for livestock products Data: FAO STAT
Soybean area and yields by country -1986 & 2010 • Increased demand met both by increased yields & increased area, esp. in Argentina & Brazil Notes: Yields are country averages. Data: FAOSTAT Garrett, Rueda, Lambin – Environ. Research Letters, Forthcoming
Land cover change in South America from Agricultural Expansion Woody Vegetation Area Agriculture & Herbaceous Area 2000-2010 (Δ KM2) <-4000 -3999 to -500 -499 to -250 -249 to 0 1 to 250 251 to 500 >500 Counties w/ 50,000 ha or more of agricultural expansion in last 10 years Clark et al. 2010
Motivating question What can be done to halt land cover change in the Amazon, Cerrado, and Chaco for cropland expansion, while still allowing Brazil to develop (via agricultural intensification & value added activities)?
Knowledge gaps • Interactions between the supply chain actors, institutions, land use • Non-linear feedbacks that can lead to rapid and unexpected changes
Questions Addressed • How do consumer preferences in Europe influence trade & supply chain infrastructure in Brazil? • How does supply chain infrastructure influence Brazilian farmers’ ability to access premiums for environmentally responsible soy? • How does competition & diversity in the supply chain influence prices, rules, & information faced by farmers, thereby influencing incentives to expand cropland?
Questions Addressed • How do consumer preferences in Europe influence trade & supply chain infrastructure in Brazil? • How does supply chain infrastructure influence Brazilian farmers’ ability to access premiums for environmentally responsible soy? • How does competition & diversity in the supply chain influence prices, rules, & information faced by farmers, thereby influencing incentives to expand cropland?
European Soy Preferences • > 70% of Japanese & European consumers prefer foods that do not contain GM materials • GM imports are not banned, but must be labeled • Meat & dairy products are excluded • Total demand for certified non-GM soy is about10% of world export market • Now also asking for soybeans that do not result in deforestation – “Environmentally Responsible” Potential Effects of Preferences • Shift trade patterns • Incentivize land use through price premiums • Non-GM & eco-certification programs
Production of non-GM soy Non-GM soy area as % of total soy area Total Non-GM soy area by country – 1996 & 2010 80% decrease Notes: Total includes only North and South America. Data: Isaaa.org Garrett, Rueda, Lambin – Environ. Research Letters, Forthcoming
Many EU countries with a strong non-GM preference shifted their imports to Brazil and away from countries that decreased their non-GM soy area, despite prices favoring US & Argentina Garrett, Rueda, Lambin – Environ. Research Letters, Forthcoming
RTRS area by state - 2012 Total eco-certified area by country - 2012 >160,000 hectares controlled by Maggi Group Data sources: Responsiblesoy.org,proterrafoundation.org, & direct communication
Conclusions • Brazil’s continued production of non-GM caused EU importers to shift trade to this country • The development of supply chains able to segregate GM from non-GM soybeans gave Brazil an advantage in producing eco-certified soy • MatoGrossohas been state most able to capitalize on certifications; especially large traders that have highly vertically integrated supply chains • Ironic because MatoGrosso is the state that experienced highest levels of direct deforestation for soy in 2000-2010 period (Macedo et al 2012)
Question Addressed • How does competition & diversity in the supply chain influence prices, rules, & information faced by farmers, thereby influencing incentives to expand cropland?
Ricardian & Thunian theories of rent (profit) Biophysical conditions Distance from markets Output & Prices Technology Incentives to expand
New economic geography theory - Process of agglomeration Profit from existing biophysical conditions & transportation costs Variety of technology & services produced in the city Number of producers that location in region Number of specialized agricultural firms that can be supported • Agglomeration creates positive externalities • Better prices, info, technology • Influences incentives to expand Garrett, Lambin, Naylor – Land Use Policy, 2013; (based on Fujitsa & Krugman 1996)
Farmer networks & access to services Santarém: good biophysical condtions low transport costs Case studies Noble Cargill ADM Dreyfus Maggi Group Caramuru Bunge COOP. Sorriso Cargill Aves Para Sojeiro Syndicate Sojeiro Nideira APROSOJA Input reseller Syndicate Input reseller 1 SICRED Input reseller 2 HSBC Rabobank FIAGRIL Bank of Brazil Sorriso: good biophysical conditions high transport costs EMBRAPA Garrett, Lambin, Naylor – Land Use Policy, 2013
Crop Area in Case Studies Santarém Sorriso 2011 1990 <1% of area in soy 63% of area in soy Source: IBGE Garrett, Lambin, Naylor – Land Use Policy, 2013
Farmer networks & access to services Santarém: good biophysical condtions low transport costs constraining institutions Case studies Noble Cargill ADM Dreyfus Maggi Group Caramuru Bunge COOP. Sorriso Cargill Aves Para Sojeiro Syndicate Sojeiro Nideira APROSOJA Input reseller Syndicate Input reseller 1 SICRED Input reseller 2 HSBC Rabobank FIAGRIL Bank of Brazil Sorriso: good biophysical conditions high transport costs EMBRAPA enabling institutions Garrett, Lambin, Naylor – Land Use Policy, 2013
Conclusions • Institutions influence how local supply chains develop • Clustering of many related agribusiness firms together creates many positive externalities that can overcome disadvantages from high transportation costs – lead to rapid expansion Sorriso- 1990 Sorriso- 2010 Garrett, Lambin, Naylor – Land Use Policy, 2013 Source: Google Earth
Conclusion • Consumer preferences influence trade flows & supply chain structures, which influences producers ability to adopt eco-certifications Non-linear process that amplify role of roads, climate, policy interventions, etc.. Can lead to unexpected development patterns • Institutions help determine how supply chains develop, which influences profitability, compliance w/ rules, & incentives to expand cropland area
Questions? Rachael D. Garrett Postdoctoral Fellow in Sustainability Science HarvardUniversity rachael_garrett@hks.harvard.edu