Download
1 / 64
640 likes | 790 Views
Data Management for Research. Michael A. Kohn, MD, MPP January 4, 2005. Assumptions about Students. Actively involved in a clinical research study Some experience with entering and maintaining data in single-table spreadsheet or statistical software

E N D
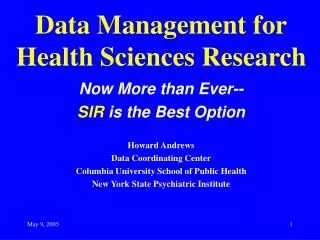
Data Management for Research Michael A. Kohn, MD, MPP January 4, 2005
Assumptions about Students • Actively involved in a clinical research study • Some experience with entering and maintaining data in single-table spreadsheet or statistical software • Some of you are here mainly to learn how to query an existing database 3 groups: ATCR/MCR, EPI non-ATCR/MCR, and CRC (GCRC or PCRC).
Housekeeping • Better of the 2 course websites: http://www.gcrc.ucsf.edu/PCRC/DBMSClass/DatabaseClass.htm • Check Lab Sheet to confirm/sign up for a lab session. (Sign up for the Tuesday 8:15 and 9:15 labs is restricted to ATCR/MCR students.) • Labs will be in S165A. • Bring a diskette, zip disk, or USB “memory stick,” and your syllabus to labs. (No printing in labs.) • Syllabus and “Learn MS Access 2000” CD
Lab Instructors Kari Mazurek (Course Administrator) Mike Jarrett Andrew High Mandana Khalili (You will find that interacting with the lab instructors, during labs, outside of labs, and via email, to be the most valuable part of this course.)
Course Objectives Learn how to develop a multi-table, relational database for a research study. We will be using Microsoft Access, but we are familiar with other database software. Learn how to query a database for monitoring and analyzing data in a research study. Example: Infant Jaundice Study
Requirements • Turn in all 4 assignments on time • Fill out course evaluation.
Assignments Lab 1: Tables and Relationships 01/11 or 01/12 Send Access file LastnameLab1.mdb to ucsfdbclass@yahoo.com by 1/17 at 5 pm. Lab 2: Queries, Reports, Importing Data 01/18 or 01/19 Save Access file as LastnameLab2.mdb Send to ucsfdbclass@yahoo.com by 1/24 at 5 pm. We will work through these assignments in the labs, so you don’t need to have Access2000 at home.
Assignments (cont’d) Lab 3: Querying, Exporting, and Analyzing Data Option A (Required for ATCR/MCR): Determine if neonatal jaundice was associated with the 5-year neuropsychiatric scores and create a table, figure, or paragraph appropriate for the “Results” section of a manuscript summarizing the association. Optional (Required for ATCR.MCR): Write a sentence or two for the “Methods” section on inter-rater reliability. (Use Bland and Altman, BMJ 1996; 313:744) Send assignment to ucsfdbclass@yahoo.com by 1/31 at 5 pm .
Assignments (cont’d) Lab 3: Querying, Exporting, and Analyzing Data 01/25 or 01/26 Option B (not for ATCR/MCR students): Answer a research question of your own by querying an existing database. Display your results in a paragraph, table, or figure appropriate for presentation to others in your field. Send assignment to ucsfdbclass@yahoo.com by 1/31 at 5 pm.
Assignments (cont’d) Class session 5 (not a lab): Planning and Budgeting for Data Management Option A: Write a one-page data management section for your research study protocol and create a budget for data management. (Please include an Access file for your database, if you have one. Also include a one-sentence summary of your study.) Send assignment to ucsfdbclass@yahoo.com by 2/14 at 5 pm
Assignments (cont’d) Class session 5 (not a lab): Planning and Budgeting for Data Management Option B: Write a one-page description with a relationships diagram for the database with which you currently work. Send assignment to ucsfdbclass@yahoo.com by 2/14 at 5 pm.
Data Management for Clinical Research • We know how to • define the study population, the independent variables and the outcome variables; • measure these variables and anticipate problems with measurement; • analyze the results.
Data Management for Clinical Research • The DBMS (Database Management System) is for • entering and storing the measurements, • entering and storing the other information necessary to administer the study (subject contact information, exam schedules, reimbursement records, etc.), • monitoring the study, and • either analyzing the results or formatting the results for analysis.
Four Types of Research Database • Combination of paper files, Excel spreadsheets, and direct keyboard entry into the statistical analysis package. • Desktop multi-table relational database. • Client-Server multi-table relational database. • Internet database server.
Advantages of a computerized database • Ease of data entry • Automatic data validation • Automatic error checking • Alternative is a stack of paper forms
Advantages of a Multi-Table Relational Database • Eliminates redundancy • Ensures data integrity • Note: Unless you plan on doing your analysis long-hand, you always need a computer database of some sort (a Stata dataset or an Excel spreadsheet may be adequate); you don’t always need a multi-table relational DBMS (like Microsoft Access).
Multi-Table Relational Database Collection of spreadsheet-like, two-dimensional tables. Rows in Tables = Records Columns in Tables = Attributes Tables are related one-to-many, many-to-many, and one-to-one.
Jaundice and Infant Feeding Study Cohort study to determine the 5-year neuropsychiatric sequelae of infants with neonatal jaundice or feeding disorders.
Infant Jaundice Study (Our fictional version of JIFee) Methods: Design-Cohort study. Setting-Single, urban medical center Subjects-Infants with neonatal jaundice and randomly selected non-jaundiced infants Predictor Variable-Presence or absence of jaundice Outcome Variable- Neuropsychiatric score (ranging from 55 to 145) at age 5 Analysis- ?
Infant Jaundice Study Data • Approximately 400 children • 5 examiners (doctors) • Approximately 700 neuropsychiatric examinations, measuring weight, height, and “NPScore” (IQ) • Some children to be examined more than once • No examiner to see the same child twice • If child died before age 5, store age and circumstances of death
Table of Study Subjects Infant Jaundice Study Table of Subjects = “Baby” Row = Individual Infant Columns = ID#, Name, DOB, Sex, Jaundice. If one set of measurements per infant, put measurements in subject table. This is a single-table database.
Demonstration: Creating a Data Table Label columns and enter rows of data in datasheet view
Demonstration: Data Dictionary • Table design view: • field (=column) names, • data types, • definitions, • validation rules • (More on data types, free-text vs. coded responses, later)
Demonstration Disallowed values Duplicate primary keys This automatic error checking and data validation IS why you need to enter your data into a computer; it is NOT why you need a relational DBMS. Many single-table products (Filemaker Pro, SAS FSP, even Excel) can do error checking and data validation.
Acceptable table showing one set of exam results per participant. (BabyExamForFigure3)
Demonstration: Same Table in Excel, Stata • Excel • Stata • Etc Rows = Records = Entities Columns = Fields = Attributes Access and Stata have a special row at the top for column headings (=field names); Excel just uses the first row.
Table of Study Subjects Table of Study Subjects Row = Individual Infant Columns = ID#, Name, DOB, Sex, Jaundice If some infants have more than one exam, what do you do?
Undesirable table showing multiple exam results per study participant. (BabyExamForFigure4)
Demo • Find highest IQ Score • Find all exams done in April
Common Error • If you find yourself creating multiple columns for the same measurement, e.g., Date1, Score1, Date2, Score2, Date3, Score3, … • Or if your table is more than about 30 columns wide, • It is time to restructure your table.
Undesirable table with participant-specific data duplicated for each exam. (Note problem with Helen’s DOB.) (ExamBabyForFigure5)
Demo • Find highest IQ Score • Find all exams in a particular month • What happened to Alejandro, Ryan, Zachary, and Jackson?
Normalization If some infants have multiple exams, “normalize” the records into two tables, one for subjects and one for examinations.
Data normalized into two tables: one (“Baby”) with rows comprising subject-specific information; the other (“Exam”) with rows comprising exam-specific information. Note that Helen can only have one birth date. Subjects with no exams, e.g. Alejandro, still appear in the database. “SubjectID” functions as the primary key in the “Baby” table and as the foreign key in the “Exam” table.
Figure 7. Relationships diagram showing the one-to-many relationship between the table of subjects (“Baby”) and the table of measurements (“Exam”).
Demonstration Inability to create integrity violations with normalized tables. This IS why you need a multi-table relational DBMS.
Analogy to Double Data Entry • Having different examiners see the same 5-year-old to establish the interrater reliability of the IQ score is analogous to doing double data entry. • The same table structures and relationships would exist if the objective were to check data entry off of paper forms. • When entering data directly into on-screen forms (with their automatic range checks and validation routines), double data entry may not be necessary.
Table of Examiners Neuropsychiatric outcomes are assessed by 5 different examiners (doctors) May want to assess whether examiner characteristics (sex, specialty, age) affect neuropsychiatric scores Doctor examines many children; each child may have more than one exam; but a child is never examined by the same doctor twice.
Figure 9. Undesirable table in which examiner-specific data is repeated with each examination. (Note that Dr. Novello is a female pediatrician for two examinations and a male internist for an exam in between.)
Figure 10. Normalization into two tables, one for exam-specific information and one for examiner-specific information. (Note that Dr. Novello cannot change specialty or gender between examinations.) “DocID” functions as a second foreign key in the “Exam” table. (The other foreign key is “SubjectID”.)
Figure 11. Relationships diagram showing the relationships between the table of subjects (Baby), the table of measurements (Exam) and the table of examiners (Doctor). The “Exam” table functions as a linkage or join table between “Baby” and “Doctor” creating a “many-to-many” relationship between study subjects and examiners.
Figure 12. Some fields are subject specific but valued for only a few subjects. Maintaining columns for these fields in the table of subjects leads to empty fields and wasted space.
Figure 13. Creating a separate table with a one-to-one relationship eliminates the empty fields and wasted space.
Figure 14. The relationships diagram now includes a table (“Death”) with a one-to-one relationship with the table of subjects (“Baby”). A subject can only have one record in the one-to-one-related table, but the vast majority of subjects will not have any “Death” record.
Undesirability of Storing Calculated Values Store raw data, not calculated fields, e.g., store dates and times; calculate intervals. Storing a patient’s birth date allows calculation of his or her exact age on the date of a particular measurement.
Figure 15. Calculated fields such as “AgeInMonths” are undesirable. What if the birth date for SubjectID 2322 (Helen) is corrected in the “Baby” table?