Download
1 / 17
170 likes | 175 Views
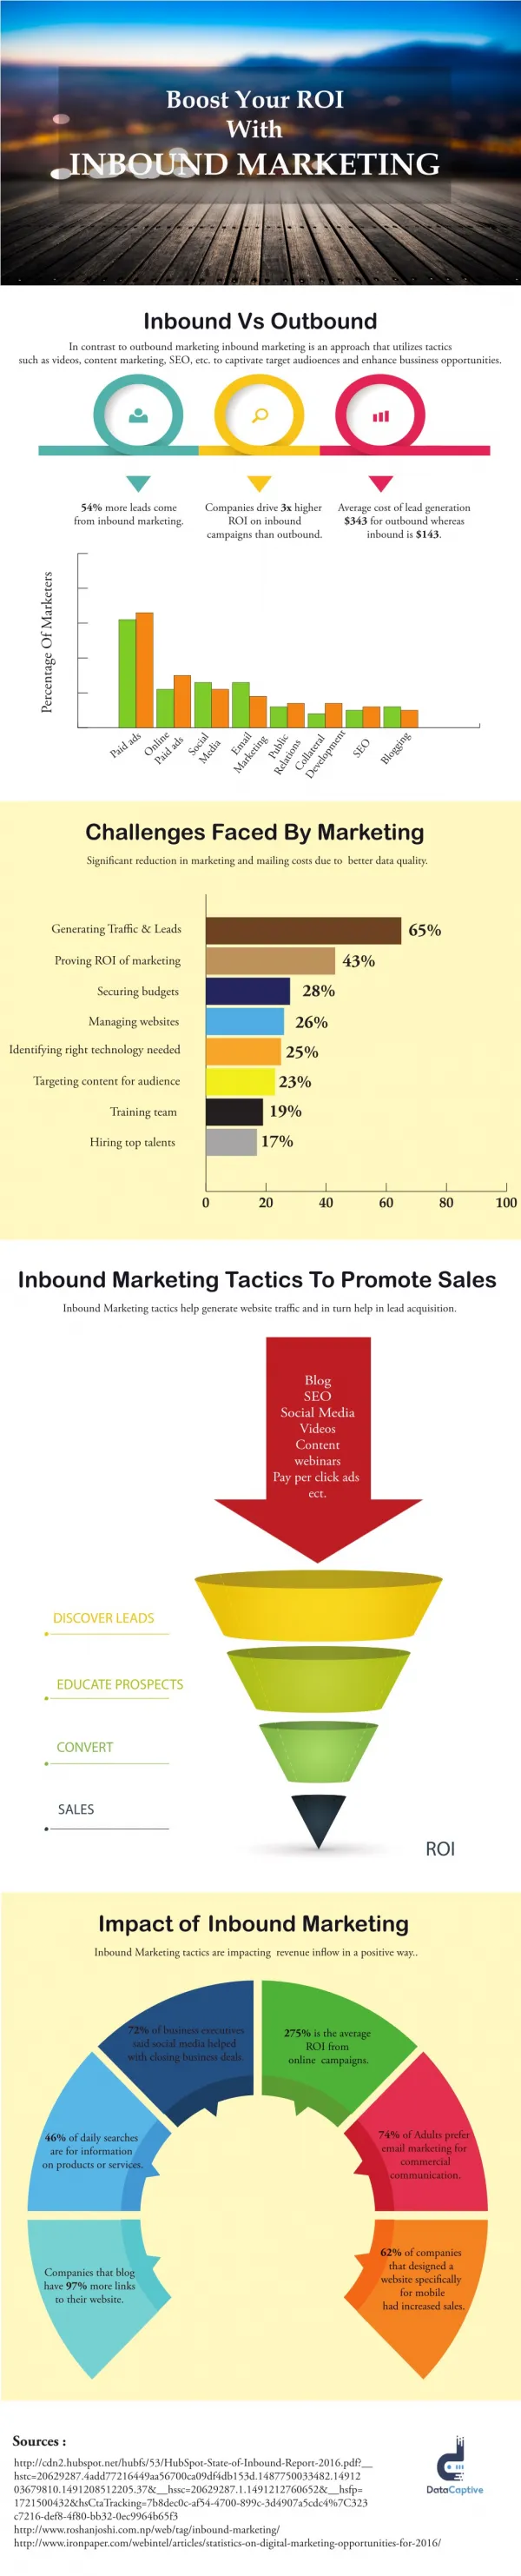
Learn more about inbound marketing and the latest best practices with our 2016 inbound marketing effectiveness report.

E N D
Inbound Marketing Effectiveness Benchmark Study Report - Q2 2016 2 Table of Contents Introduction 3 Executive Summary 4 What Drives the Business? 5 Importance and Performance 8 Tactics in Use 11 Analyst Bottom Line 14 Acknowledgements 15 Appendix – Survey Background 16 © 2016 Demand Metric Research Corporation. All Rights Reserved. License our research to fuel your content marketing programs. Contact us at info@demandmetric.com or +1 (866) 947-7744
Inbound Marketing Effectiveness Benchmark Study Report - Q2 2016 3 INTRODUCTION Are inbound marketing tactics alone adequate to grow a business? This study’s goal was to find out. There is no shortage of research and opinion about the efficacy of inbound marketing. Inbound marketing activities are designed to attract a prospect to your destination, offer or experience whereas outbound activities rely on the company reaching into the market to engage with prospects who may not know about the company yet. Over the last decade, marketers have enthusiastically embraced the term “inbound,” and have reaped its benefits. The popularity of inbound marketing may lead some to conclude that outbound marketing is not as effective. Marketers, whose resources are often challenged by where to best invest their budgets: in inbound marketing, a strategy whose fortunes continue to rise, or in outbound, the more traditional strategy that holds it weight in performance. This study provides insights into what marketers say they’re doing and where they’re investing. To get these insights, Demand Metric and Act-On Software partnered to field this study’s survey. The approach to this research was not to take a view that inbound and outbound strategies and tactics were on opposite sides of a political divide, or that one was right and the other wrong. The research did not attempt to ascribe qualities or benefits to either approach, but simply measure them. The goal was to inventory the tactics in use, the proclivity to use one, the other or both, and to understand the investment and performance of each. This report presents the findings of this research, providing all marketers with a useful set of benchmarks to compare their use of these approaches. © 2016 Demand Metric Research Corporation. All Rights Reserved. License our research to fuel your content marketing programs. Contact us at info@demandmetric.com or +1 (866) 947-7744
Inbound Marketing Effectiveness Benchmark Study Report - Q2 2016 4 EXECUTIVE SUMMARY Most of this study’s participants were from emerging to mid-sized B2B growth organizations. Over half of the respondents had a marketing job title, and well over half were in organizations that experienced revenue growth in the last fiscal year. The analysis of this study’s data provides these key findings: ! The study tested agreement with statements that inbound alone, outbound alone or both types of tactics together drive the business. The highest level of agreement, at 84 percent was with the statement that inbound and outbound tactics together drive the business. ! For this study’s participants, inbound and outbound tactics are generating almost equal amounts of leads. ! The importance of, the revenue from and the marketing budget allocations for inbound and outbound tactics were virtually equal. ! Over half of the study’s participants say they will increase their investment in inbound tactics over the next 12 months. Just over one-third plan to increase their outbound tactics investment over the same period. This report details the results and insights from the analysis of the study data. For more detail on the survey participants, please refer to the Appendix. © 2016 Demand Metric Research Corporation. All Rights Reserved. License our research to fuel your content marketing programs. Contact us at info@demandmetric.com or +1 (866) 947-7744
Inbound Marketing Effectiveness Benchmark Study Report - Q2 2016 5 WHAT DRIVES THE BUSINESS? Which kinds of tactics do marketers say are most responsible for driving and growing their business? Marketing is ideally a revenue center, so the study survey collected the necessary data to determine which set of tactics – inbound, outbound or both – are most responsible for driving the business. To develop this view, study participants were asked to indicate their agreement with these statements: 1. Inbound marketing tactics alone drive our business 2. Outbound marketing tactics alone drive our business 3. Inbound and outbound marketing tactics together drive our business Figure 1 shares the data aggregated from these queries. Agreement on Which Tactics Drive the Business Disagree Neutral Agree 84% 63% 54% 28% 23% 18% 14% 9% 7% Outbound tactics Inbound tactics Both types of tactics Figure 1: Most study participants agree that a blend of tactics drives their businesses. Comparing just inbound to outbound in Figure 1, the response percentages nearly mirror one another: almost equal levels of agreement exist. There is strong agreement that both tactics together drive business and it stands in stark contrast to the tepid agreement levels that either inbound or outbound alone drive business. © 2016 Demand Metric Research Corporation. All Rights Reserved. License our research to fuel your content marketing programs. Contact us at info@demandmetric.com or +1 (866) 947-7744
Inbound Marketing Effectiveness Benchmark Study Report - Q2 2016 6 WHAT DRIVES THE BUSINESS? Taking a closer look at the data in Figure 1 does reveal some firmographic differences based on the preferences expressed for inbound, outbound or a blend of these tactics. For example, the survey participants that agree that outbound tactics alone drive their business have a greater B2C orientation. Furthermore, companies in the study that agree inbound tactics alone drive their businesses are more likely to be small in terms of annual revenue. Figure 2 compares the preference for tactics across two annual revenue segments: companies with less than $100 million in annual revenue, and those with $100 million or more. Tactic Preference by Annual Revenue Less than $100 million $100 million or more 10% 10% 33% Inbound alone Outbound alone In/Outbound together Figure 2: Larger companies are more likely to use both tactics. Small companies – those making less than $100 million in annual revenue – are most likely to agree that a single type of tactic but not both drive their business. Of those who agree that inbound tactics alone drive their business, 90 percent are small companies. The same percentage holds for outbound tactics alone usage. © 2016 Demand Metric Research Corporation. All Rights Reserved. License our research to fuel your content marketing programs. Contact us at info@demandmetric.com or +1 (866) 947-7744
Inbound Marketing Effectiveness Benchmark Study Report - Q2 2016 7 WHAT DRIVES THE BUSINESS? Smaller companies may not believe they have the bandwidth to drive their businesses using both kinds of tactics. It is the larger companies in the study that are blending inbound and outbound tactics together to drive their business. Quite often, the output of successful inbound or outbound marketing is a lead, and the survey measured which type of marketing was responsible for generating more of the leads a company gets. Figure 3 shares this performance. Which Approach Generates More Leads? Both equally, 13% I don’t know, 23% Outbound, 32% Inbound, 32% Figure 3: Inbound and Outbound marketing generate equal numbers of leads for this study’s participants. Neither inbound nor outbound has the advantage when it comes to generating the most leads. If there is a surprise in the data summarized in Figure 3, it’s the number of “I don’t know” responses at almost one-fourth of the total. Marketers cannot allow themselves to remain ignorant of which approaches are helping to fill the revenue pipeline. © 2016 Demand Metric Research Corporation. All Rights Reserved. License our research to fuel your content marketing programs. Contact us at info@demandmetric.com or +1 (866) 947-7744
Inbound Marketing Effectiveness Benchmark Study Report - Q2 2016 8 IMPORTANCE AND PERFORMANCE The importance level of inbound and outbound marketing was measured by the study survey, using a scale from 1 to 10 where 1 = very unimportant and 10 = very important. Table 1 summarizes this importance data. Type of Marketing Average Importance 7.4 Inbound 7.3 Outbound Table 1: The average importance of the two approaches is virtually identical. Both approaches scored high on the importance scale, and of equal interest, their scores were essentially the same. Inbound marketing is not perceived as more important than outbound. Any perception that may exist in the marketing community that one type of marketing is universally more important than the other is refuted by this data. The perceived importance shown in Table 1 is a reflection of value, and the study survey took a more direct measure of value: the percentage of annual revenue produced by inbound and outbound tactics. Figure 4 presents this data. % of Annual Revenue from Inbound & Outbound 43% 41% Inbound Outbound Figure 4: When it comes to revenue attribution, parity exists between approaches. © 2016 Demand Metric Research Corporation. All Rights Reserved. License our research to fuel your content marketing programs. Contact us at info@demandmetric.com or +1 (866) 947-7744
Inbound Marketing Effectiveness Benchmark Study Report - Q2 2016 9 IMPORTANCE AND PERFORMANCE There is essentially no difference in how inbound and outbound marketing are generating revenue for this study’s participants. Even those who report that inbound marketing tactics alone drive their business still report that over 25 percent of their revenue is the result of outbound marketing tactics. For those reporting that outbound marketing tactics alone drive their business, over 36 percent of their revenue is the result of inbound marketing tactics. What’s also worthy of note is that almost everything the study participants are doing - 84 percent – falls within one of these two approaches. Inbound and outbound marketing combined account for most organizations’ annual revenue. marketers may argue that the only kinds of marketing that exist are inbound and outbound, but Scott Brinker on the Chiefmartec.com blog has identified 131 different kinds of marketing. Many of them fall within either inbound or outbound, so clearly these two categories make up the lion’s share of marketing that is done, but not all. The picture is similar for marketing budget allocation between inbound and outbound, as Figure 5 depicts. Some % of Annual Marketing Budget Spent on Inbound & Outbound 48% 44% Inbound Outbound Figure 5: Outbound edges out inbound on the annual budget allocation. © 2016 Demand Metric Research Corporation. All Rights Reserved. License our research to fuel your content marketing programs. Contact us at info@demandmetric.com or +1 (866) 947-7744
Inbound Marketing Effectiveness Benchmark Study Report - Q2 2016 10 IMPORTANCE AND PERFORMANCE As the study data has consistently shown, the differences between inbound and outbound are narrow, and so too is the budget allocation delta. However, the relative equality in budget allocation doesn’t mean the same amount of inbound and outbound marketing is being done. An advantage that inbound has enjoyed over outbound is the lower, relative cost. Relatively equal spending, therefore, doesn’t translate into equal amounts of marketing occurring in each category. Since the study survey collected data that categorized respondents based on which kind of marketing drives their business (Figure 1), it’s possible to segment those who agree that inbound alone drives their business from those who agree that outbound alone does so. Table 2 shows this segmentation. % Annual Marketing Budget Allocated to Inbound % Annual Marketing Budget Allocated to Outbound SEGMENT 68% 25% Inbound drives the business 37% 59% Outbound drives the business Table 2: Even those who agree that one type of marketing drives their business still allocate part of their budget to the other type of marketing. Even though marketers agree that one type of marketing or the other alone drive their businesses, their budget allocations betray them. Clearly, the allocations are shaded toward the type of marketing that marketers say drives their businesses, but spending is occurring for inbound and outbound marketing. © 2016 Demand Metric Research Corporation. All Rights Reserved. License our research to fuel your content marketing programs. Contact us at info@demandmetric.com or +1 (866) 947-7744
Inbound Marketing Effectiveness Benchmark Study Report - Q2 2016 11 TACTICS IN USE The study took a high-level inventory of the inbound and outbound tactics in use by survey respondents. Figure 6 summarizes the frequency of use for inbound tactics. Inbound Marketing Tactics in Use Social 82% SEO (organic) 82% Blogging 60% PPC 41% 3rd party 20% Other tactics 13% Figure 6: Almost all study participants are using social media and doing SEO. The “Other tactics” category included a list of items volunteered by survey participants, many of which were actually outbound tactics, such as email and digital advertising, revealing an imprecise understanding of inbound marketing. Figure 7 summarizes the frequency of use of outbound tactics. Outbound Marketing Tactics in Use Email marketing 90% Tradeshows/conferences 62% Press releases/media relations 61% Webinars/virtual events 52% Direct mail 33% Print/radio/billboard ads 25% Other tactics 14% Figure 7: Email is the leading outbound marketing tactic. © 2016 Demand Metric Research Corporation. All Rights Reserved. License our research to fuel your content marketing programs. Contact us at info@demandmetric.com or +1 (866) 947-7744
Inbound Marketing Effectiveness Benchmark Study Report - Q2 2016 12 TACTICS IN USE The “Other tactics” category items volunteered by study participants included cold calling, sponsorships, telemarketing, promotional products and contests. The data in Figures 6 and 7 was segmented to discover if there are differences in the tactics in use by those who claim inbound tactics only drive their business, outbound tactics alone do, or both. Table 3 displays this segmentation for the inbound tactics shown in Figure 6. Inbound alone drives the business 3rd Party Reviews SEGMENT SEO Social Blogging PPC 77% 59% 64% 36% 9% Outbound alone drives the business 60% 75% 35% 20% 20% Inbound/outbound together 83% 86% 63% 43% 19% Table 3: Highest use of most inbound tactics is by firms relying on inbound and outbound to drive their businesses. Table 3 reveals that the approach a firm takes, whether inbound, outbound or both, doesn’t affect which tactics are in use, only the degree to which they are in use. What is a bit counterintuitive is that those who claim inbound tactics alone drive their business don’t have the highest frequency of use of inbound tactics. Without the advantage of the survey data, it’s reasonable to assume that this segment would lead in the usage of inbound tactics. Another reasonable assumption to make without the benefit of data is that those who claim that outbound tactics alone drive their business would not use inbound tactics. The data, however, shows that this assumption is false as well. It is curious that the lowest usage of social media is by the segment claiming that inbound tactics alone drive their business. © 2016 Demand Metric Research Corporation. All Rights Reserved. License our research to fuel your content marketing programs. Contact us at info@demandmetric.com or +1 (866) 947-7744
Inbound Marketing Effectiveness Benchmark Study Report - Q2 2016 13 TACTICS IN USE Webinars/ Virtual Events Print/ Radio/ Billboard Trade-shows/ Conference Direct mail SEGMENT PR/Media Email Inbound alone drives the business 32% 86% 36% 41% 15% 23% Outbound alone drives the business 45% 90% 45% 55% 20% 45% Both drive the business 66% 93% 55% 66% 28% 37% Table 4: Highest use of all outbound tactics except direct mail is by firms relying on inbound and outbound to drive their businesses. Table 4 bears a strong similarity to Table 3 in that the approach a firm takes, whether inbound, outbound or both, doesn’t affect which tactics are in use, only the degree to which they are in use. What is also quite obvious from studying Tables 3 and 4 is that there really aren’t any firms that rely exclusively just on inbound, or outbound tactics. There are no “purists” when it comes to one approach or the other, at least not in this study. The norm is to blend both kinds of tactics, and while one type may dominate, both are deployed. © 2016 Demand Metric Research Corporation. All Rights Reserved. License our research to fuel your content marketing programs. Contact us at info@demandmetric.com or +1 (866) 947-7744
Inbound Marketing Effectiveness Benchmark Study Report - Q2 2016 14 ANALYST BOTTOM LINE An organization may perceive that it is growing its business through either inbound or outbound tactics alone, but the data from this study reveals the truth: the organization that uses just one or the other is a rare anomaly. In fact, none were found in this study’s sample. It’s safe to conclude neither inbound nor outbound marketing tactics alone are adequate to drive a business. Instead, this study shows that Inbound and Outbound have a symbiotic relationship. If further proof is needed that both types of tactics are necessary to drive a business, consider the planned investment data shown in Figure 8. Planned Investment Over the Next 12 Months Inbound Outbound 58% 46% 39% 35% 15% 7% More Same Less Figure 8: Few study participants plan to decrease funding of either type of tactic. While inbound marketing tactics will see a larger investment over the coming year, study participants don’t indicate that funding will dry up for outbound tactics. This study finds that any proclamations that outbound marketing is dead are simply untrue. Inbound and outbound tactics both offer advantages. Marketers should strive to first understand the audience they’re trying to reach, and develop personas to guide the choice of messages and channels through which those messages are delivered. While it is likely that the choice of tactics will emphasize one approach over the other, almost every marketer will achieve the greatest effectiveness by blending inbound and outbound tactics. © 2016 Demand Metric Research Corporation. All Rights Reserved. License our research to fuel your content marketing programs. Contact us at info@demandmetric.com or +1 (866) 947-7744
Inbound Marketing Effectiveness Benchmark Study Report - Q2 2016 15 ACKNOWLEDGEMENTS Demand Metric is grateful to Act-On Software for sponsoring this research, and for those who took the time to complete the study survey. About Act-On Software Act-On Software is a marketing automation company delivering innovation that empowers marketers to do the best work of their careers. Act-On is the only integrated workspace to address the needs of the customer experience, from brand awareness and demand generation, to retention and loyalty. With Act-On, marketers can drive better business outcomes and see higher customer lifetime value. The Act- On platform provides marketers with power they can actually use, without the need for a dedicated IT resource. For more information, visit www.act-on.com. About Demand Metric Demand Metric is a marketing research and advisory firm serving a membership community of over 70,000 marketing professionals and consultants in 75 countries. Offering consulting methodologies, advisory services, and 500+ premium marketing tools and templates, Demand Metric resources and expertise help the marketing community plan more efficiently and effectively, answer the difficult questions about their work with authority and conviction and complete marketing projects more quickly and with greater confidence, boosting the respect of the marketing team and making it easier to justify resources the team needs to succeed. To learn more about Demand Metric, please visit: www.demandmetric.com. © 2016 Demand Metric Research Corporation. All Rights Reserved. License our research to fuel your content marketing programs. Contact us at info@demandmetric.com or +1 (866) 947-7744
Inbound Marketing Effectiveness Benchmark Study Report - Q2 2016 16 APPENDIX: SURVEY BACKGROUND This 2016 Inbound Marketing Effectiveness Benchmark Study survey was administered online during the period of October 21 through December 2, 2016. During this period, 154 responses were collected, 131 of which were qualified and complete enough for inclusion in the analysis. Only valid or correlated findings are shared in this report. The representativeness of this study’s results depends on the similarity of the sample to environments in which this survey data is used for comparison or guidance. Summarized below is the basic categorization data collected about respondents to enable filtering and analysis of the data: Type of organization: " Primarily B2B 70 percent " Primarily B2C 11 percent " Mixed B2B/B2C 19 percent Primary role of respondent " President, CEO or owner 19 percent " Marketing 55 percent " Sales 11 percent " Creative or content producer 5 percent " IT or tech resource 2 percent " Other 8 percent Annual sales: " Less than $10 million 52 percent " $10 to $24 million 11 percent " $25 to $99 million 15 percent " $100 to $499 million 11 percent " $500 to $999 million 3 percent " $1 billion or more 8 percent © 2016 Demand Metric Research Corporation. All Rights Reserved. License our research to fuel your content marketing programs. Contact us at info@demandmetric.com or +1 (866) 947-7744
Inbound Marketing Effectiveness Benchmark Study Report - Q2 2016 17 APPENDIX: SURVEY BACKGROUND Revenue growth environment in most recent fiscal year: " Significant increase " Slight increase " Flat " Slight decline " Significant decline " I don’t know 20 percent 50 percent 14 percent 7 percent 5 percent 4 percent © 2016 Demand Metric Research Corporation. All Rights Reserved. License our research to fuel your content marketing programs. Contact us at info@demandmetric.com or +1 (866) 947-7744