1 / 2
20 likes | 26 Views
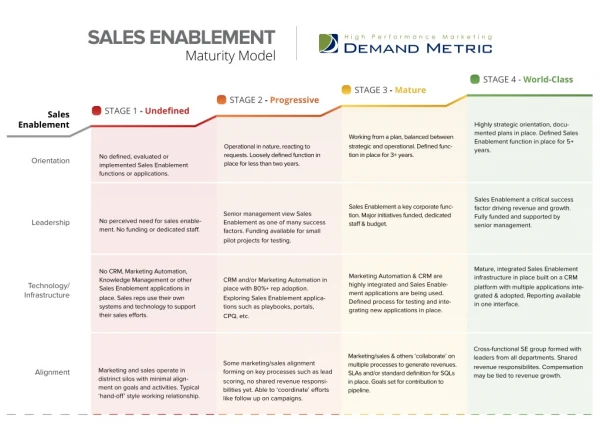
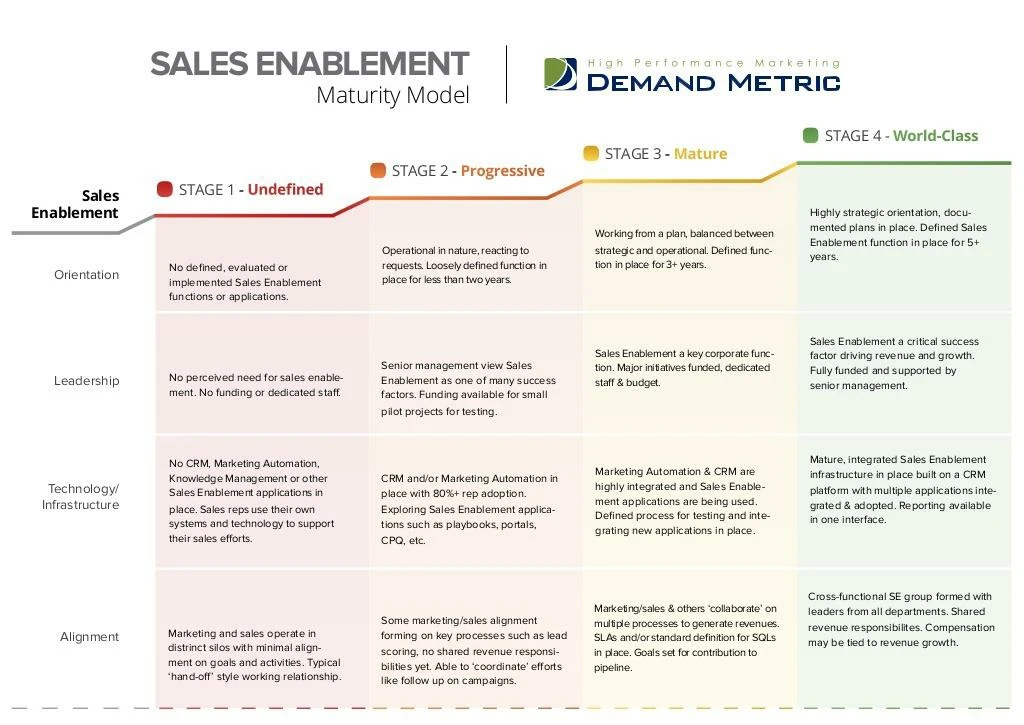
Our Sales Enablement Maturity Model was designed to help organizations with a roadmap for improving their sales enablement capabilities.

E N D
Sales Enablement Maturity Model SALES ENABLEMENT Maturity Model Orientation STAGE 1 - Undefined STAGE 2 - Progressive STAGE 3 - Mature STAGE 4 - World-Class Technology/ Infrastructure No defined, evaluated or implemented Sales Enablement functions or applications. No CRM, Marketing Automation, Knowledge Management or other Sales Enablement applications in place. Sales reps use their own systems and technology to support their sales efforts. CRM and/or Marketing Automation in place with 80%+ rep adoption. Exploring Sales Enablement applica- tions such as playbooks, portals, CPQ, etc. Marketing Automation & CRM are highly integrated and Sales Enable- ment applications are being used. Defined process for testing and inte- grating new applications in place. Mature, integrated Sales Enablement infrastructure in place built on a CRM platform with multiple applications inte- grated & adopted. Reporting available in one interface. Operational in nature, reacting to requests. Loosely defined function in place for less than two years. Working from a plan, balanced between strategic and operational. Defined func- tion in place for 3+ years. Highly strategic orientation, docu- mented plans in place. Defined Sales Enablement function in place for 5+ years. Leadership No perceived need for sales enable- ment. No funding or dedicated staff. Senior management view Sales Enablement as one of many success factors. Funding available for small pilot projects for testing. Sales Enablement a key corporate func- tion. Major initiatives funded, dedicated staff & budget. Sales Enablement a critical success factor driving revenue and growth. Fully funded and supported by senior management. Alignment Cross-functional SE group formed with leaders from all departments. Shared revenue responsibilites. Compensation may be tied to revenue growth. Marketing and sales operate in distrinct silos with minimal align- ment on goals and activities. Typical ‘hand-off’ style working relationship. Some marketing/sales alignment forming on key processes such as lead scoring, no shared revenue responsi- bilities yet. Able to ‘coordinate’ efforts like follow up on campaigns. Marketing/sales & others ‘collaborate’ on multiple processes to generate revenues. SLAs and/or standard definition for SQLs in place. Goals set for contribution to pipeline. Sales Enablement
SALES ENABLEMENT Maturity Model Sales Support Tools Processes Metrics Results No formal lead generation or sales opportunity management process; Sales process & buying processes are not defined. No formal support or tools for asset management, CPQ, communica- tion or other tools. No centralized portal for collateral (email templates, proposals, playbooks, etc.) Reps expected to create their own sales support material. Sales enablement success metrics unknown and not tracked. Revenue ($) tracked but not necessarily tied to goals. Lead quality and scoring is unknown and not tracked. New reps hit quota in 9-12 months. 30-50% of new sales hired unsuccessful. Opportunity win rate is less than 10%. Revenue growth rate is less than 10%. Metrics in place to measure effec- tiveness such as #opportunities, sales productivity metrics, #leads generated, CPL in some cases known. No regular monitoring, reports pulled ad hoc when results not desirable. New reps hit quota in 6-9 months. 20-30% of new sales hires unsuc- cessful. Opportunity win rate is 10-15%. Revenue growth rate is 10-20%. Known success metrics for top performing reps. Cost of acquisition (CAC) known, #downloads from portals, CRM adoption rate, cost per opportu- nity measured. Reports monitored and reviewed at regular intervals (weekly, monthly, quarterly, annually). New reps hit quota in 4-6 months. 10-20% of new sales hires unsuc- cessful. Opportunity win rate is 15-20%. Revenue growth rate is 20-40%. Marketing ROI, TCO, age of opportuni- ties, customer lifetime value, retention rate, pipeline velocity, reps have visi- bility into team’s productivity & perfor- mance metrics (may be gamified inside of CRM), closed loop reporting system for all campaigns and metrics. New reps hit quota in 3-4 months. Less than 10% of new sales hires are unsuccessful. Opportunity win rate is 20%+. Revenue growth rate is 40%+. Sales process defined but not mapped to buying process. Opportunity management is ad hoc and unreliable for forecasting. No sales enablement processes established yet. Basic asset management and/or sales portal with collateral, manual CPQ, conferencing tools provided. May have manual sales playbooks, sales intelligence data sources, competitive analysis info, formal product training. Formal lead acquisition process, solid opportunity management, Sales process mapped to buying process, defined process for sales enablement including strategy planning. Extensible platform supports MRM, asset management with ratings, feedback and version control, sales performance/incen- tive management, CPQ, conferencing, playbooks integrated with CRM, field presentation tools for tablets, etc. Lead scoring & nurturing, content mapped to buying and sales process by persona & journey maps, prioritiza- tion of sales enablement strategy plan is done regularly. Sales organization fully supported across entire sales cycle from lead generation to quoting and contracting. Reporting and feedback effectively drive development of sales support infrastructure. Surveys held regularly to solicit feedback and ideas. STAGE 1 - Undefined STAGE 2 - Progressive STAGE 3 - Mature STAGE 4 - World-Class Sales Enablement SALES ENABLEMENT Maturity Model Sales Support Tools Processes Metrics Results No formal lead generation or sales opportunity management process; Sales process & buying processes are not defined. No formal support or tools for asset management, CPQ, communica- tion or other tools. No centralized portal for collateral (email templates, proposals, playbooks, etc.) Reps expected to create their own sales support material. Sales enablement success metrics unknown and not tracked. Revenue ($) tracked but not necessarily tied to goals. Lead quality and scoring is unknown and not tracked. New reps hit quota in 9-12 months. 30-50% of new sales hired unsuccessful. Opportunity win rate is less than 10%. Revenue growth rate is less than 10%. Metrics in place to measure effec- tiveness such as #opportunities, sales productivity metrics, #leads generated, CPL in some cases known. No regular monitoring, reports pulled ad hoc when results not desirable. New reps hit quota in 6-9 months. 20-30% of new sales hires unsuc- cessful. Opportunity win rate is 10-15%. Revenue growth rate is 10-20%. Known success metrics for top performing reps. Cost of acquisition (CAC) known, #downloads from portals, CRM adoption rate, cost per opportu- nity measured. Reports monitored and reviewed at regular intervals (weekly, monthly, quarterly, annually). New reps hit quota in 4-6 months. 10-20% of new sales hires unsuc- cessful. Opportunity win rate is 15-20%. Revenue growth rate is 20-40%. Marketing ROI, TCO, age of opportuni- ties, customer lifetime value, retention rate, pipeline velocity, reps have visi- bility into team’s productivity & perfor- mance metrics (may be gamified inside of CRM), closed loop reporting system for all campaigns and metrics. New reps hit quota in 3-4 months. Less than 10% of new sales hires are unsuccessful. Opportunity win rate is 20%+. Revenue growth rate is 40%+. Sales process defined but not mapped to buying process. Opportunity management is ad hoc and unreliable for forecasting. No sales enablement processes established yet. Basic asset management and/or sales portal with collateral, manual CPQ, conferencing tools provided. May have manual sales playbooks, sales intelligence data sources, competitive analysis info, formal product training. Formal lead acquisition process, solid opportunity management, Sales process mapped to buying process, defined process for sales enablement including strategy planning. Extensible platform supports MRM, asset management with ratings, feedback and version control, sales performance/incen- tive management, CPQ, conferencing, playbooks integrated with CRM, field presentation tools for tablets, etc. Lead scoring & nurturing, content mapped to buying and sales process by persona & journey maps, prioritiza- tion of sales enablement strategy plan is done regularly. Sales organization fully supported across entire sales cycle from lead generation to quoting and contracting. Reporting and feedback effectively drive development of sales support infrastructure. Surveys held regularly to solicit feedback and ideas. STAGE 1 - Undefined STAGE 2 - Progressive STAGE 3 - Mature STAGE 4 - World-Class Sales Enablement