Download
1 / 38
390 likes | 593 Views
Market Access Map Market Research from a tariff barrier perspective. Agenda. Background – market access issues today Presentation – Market Access Map Practical Exercises. Are tariff barriers still a problem?.

E N D
Market Access Map Market Research from a tariff barrier perspective
Agenda • Background – market access issues today • Presentation – Market Access Map • Practical Exercises
Are tariff barriers still a problem? Source: 2004 UN Report of the implementation of the Millennium Development Goals – (estimates from UNCTAD, World Bank & WTO)
Note • The average developing country belongs to 5 separate regional trade agreements (Global Economic Prospects, Trade Regionalism and Development, World Bank, 2005) – eg EU, NAFTA, COMESA • Hard to keep track of what tariffs your own country applies and faces as well as the tariffs faced by your competitors • Need for greater transparency on tariffs and rules of origin
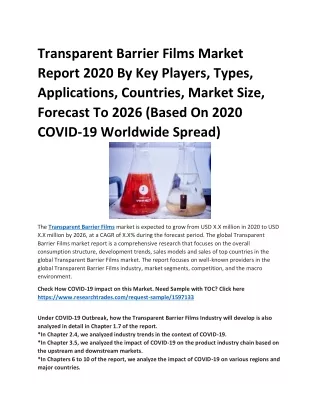
Market Access Trends Average APEC Tariff Rate % Average number of antidumping measures per year Source: Spinanger, Dean “Misuse of AD measures and NTBs”, 2002
Market Access Trends • Increase in use of non-tariff measures • Eg: Environmental measures include measures covering: • Food and Plant health standards • Production regulations • Testing requirements • Certification procedures • US$ 300 billion of world imports are potentially affected by environmental protectionism, of which less than 10 per cent manages to reach the requested standards. Source: An Assessment of Environmentally-Related Non-Tariff Measures, Lionel Fontagné, Friedrich von Kirchbach, Mondher Mimouni, considering data for 2001
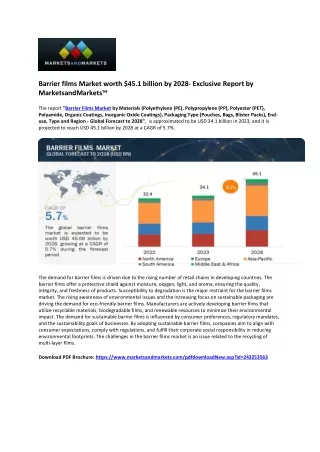
Choose whether you wish to see the most detailed product codes (national tariff line) or at the HS 6 digit level Start typing your product name or code & select a match from the drop-down list of possible options
Harmonised System - Quick Revision • International • 08 Edible fruit and nuts; peel of citrus fruits or melons • 0804 Dates, figs, pineapples, avocados, guavas, mangoes and mangosteens, fresh or dried • 080450 Guavas, mangoes and mangosteens, fresh or dried • National (e.g. USA) • 08045040 Guavas, mangoes and mangosteens, fresh • 08045080 Guavas, mangoes and mangosteens, dried
Preferences are displayed (if applicable) as well as the MFN or general rate
See trade regimes that a country applies or faces and rules of origin for many tradeagreements
Which trading partners offer the best market access for Ghana’s cocoa beans?
Click on the heading “level of protection” to sort by those offering the lowest tariff
Create a variety of useful reports on your country or on one of your trading partners
Top 200 export transactions, the import partner per transaction and the top 3 exporters to the partner
Imagine we want to compare the tariffsof several productsexported to several marketsAnd we’d like to see our country’s situation relative to our competitors
Click on the “Detailed Analysis” tab – it will expand to reveal 3 sub tabs. Select “Applied Tariffs”
Types of tariff barriers… • Ad valorem tariffs: • levied on the basis of the value • Eg: 20% of the value of the imported product (majority of countries) • Specific tariffs: • levied on the basis of volume or weight or unit • Eg: $2 per kilogram (Switzerland, USA, EU, Japan)
MAcMap Features: Ad Valorem Equivalents • Ad valorem equivalent tariffs for • specific tariffs, tariff quotas and anti-dumping measures • AVE = Specific tariff per unit • Unit Value • AVEs allow us to aggregate tariffs at the sector or regional level; and • AVEs allow us to compare the protection levels of different countries • Total AVE – sum of each of the ad valorem equivalents
If South Africa’s exported fish fillets were worth $100 per ton If Ghana’s exported fish fillets were worth $200 per ton Example – why is this is an issue? Imagine Switzerland applies a tariff of $100 per ton to imports of fish fillets from South Africa &Ghana the equivalent tariff would be 100% the equivalent tariff faced would be only 50% !
Compare exporters AVEs make it easy to compare the protection applied to different exporters
Additional support material A glossary to look up tariff terminology
Search the Glossary for the term you with to learn more about
Read about the Market Access Map methodology for calculating AVEs
Sources of Data • Market Access Map is updated as new tariff data becomes available. Data is sourced from: • 2005 data currently available for 25 EU countries, USA, Canada, Switzerland and Tunisia • Tariff data reported to the UN Tariff and Market Access Database (UN TARMAC) of ITC and UNCTAD • Bound tariff data from the Consolidated Tariff Schedule of the WTO • Tariff quota data from WTO (agricultural notification of tariff quota) and national sources for bilateral and regional tariff quota agreements • Notifications from member countries of the WTO regarding anti-dumping duties and ITC collection directly from some countries. • Trade data from national sources, IDB (integrated database) /WTO and the COMTRADE database of the United Nations Statistics Division (UNSD).
Summary: features of MacMap • WIDE GEOGRAPHICAL COVERAGE: tariffs applied by 170 countries to the products exported by over 200 countries and territories. • WIDE COVERAGE OF INSTRUMENTS: Covers: ad-valorem tariffs; specific tariffs; tariff quotas; and antidumping duties • PREFERENCES: Covers most bilateral and regional agreements. Rules of Origin and Certificates of origin are also included for many agreements. • ANALYTICAL FLEXIBILITY: Permits analysis by region, by economic sector or by measure