Download
1 / 24
250 likes | 530 Views
Arctic Amplification. Brady Harris. Our Poles are warming. http:// www.youtube.com/watch?v=PTksae5SNQk. Why do we care??. http:// www.youtube.com/watch?v=GWj2DzKn7MA Yea Boom son!!!!. Polar Amplification. Greater temperature increase when compared to the rest of the globe

E N D
Arctic Amplification Brady Harris
Our Poles are warming http://www.youtube.com/watch?v=PTksae5SNQk
Why do we care?? • http://www.youtube.com/watch?v=GWj2DzKn7MA • Yea Boom son!!!!
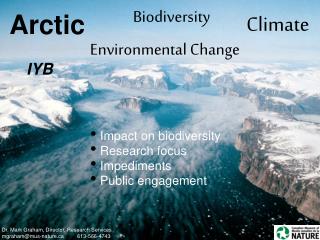
Polar Amplification • Greater temperature increase when compared to the rest of the globe • Enhanced warmer of the arctic, especially north of 59 degrees N. • Influenced by a number of feedbacks such as the ice albedo feedback.
What Causes PA? • Several Factors: • Arctic is surrounded by land, which heats and cools much faster than water, causing a higher dependence on the temperature • Snow and ice cover of land=reflects sunlight causing most of longwave radiation is reflected back into space. Higher temperature=more snow melt which would lead to an even higher temperature. • As northern polar area warms, ice cap melts faster in summer, causing a lesser rate of arctic ice cap cooling present in the summer. • As ice melts in arctic, more water is exposed, allows oceans to heat up at faster rate/melt more ice/increase ocean temps. • Equator to pole heat transports which may be related to changes in turbulent and longwave radiation forcing's and the jet that is created. • Grouped into several feedbacks which my partner will go over.
Any Problems? • Ice-albedo feedback was thought to be the main contributor of PA. • Other feedbacks are known, but the amount they contribute is uncertain. • Paper will take a look at that.
Paper VLADIMIR A. ALEXEEV Bekryaev et al. 2010 • IGOR V. POLYAKOV ROMAN V. BEKRYAEV University of Alaska Fairbanks • Russian State Hydrometeorological Institute- Doctor of Science • Arctic and Antarctic Research Institute- got a Ph.D in physical oceanography
Data Also from a previously unused data collection was the book Climatologic Reference Book of the USSR.
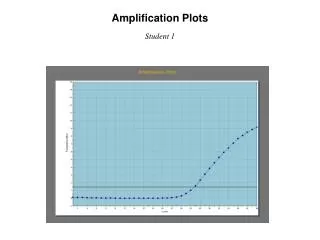
Figures that best demonstrated this Polar Amplification Some graphs composed by the paper.
Of course there is going to be MDV! • Multidecadal variability- drastic differences between SAT’s of multiple decades. • However, over the past decade, the arctic warming rate was 1.35 degrees C/decade. • Gives evidence to believe that this is not some fluke, but an overall warming trend is taking place.
Note: The warming over the 1930’s/40’s was more confined to certain seasons, where as the warming since the late 1970’s has been more uniform over all the seasons as well as being amplified. Large Scale vs. Local PA • Large scale PA- polar amplification based on a hemispheric scale Vs. Local PA- polar amplification confined to the Northern Polar Area
Large Scale PA • If you look at both graphs from last page, you will see relationship between NH and NPA SAT trends over the past 100 years. • Paper suggests that NPA SAT trends lead to low latititude SAT’s, but also says that this proposition should be viewed with caution. • To relate these two trends, a new term was determined.
Determined new value of comparing Northern Hemisphere (NH) temperature trends to North Polar Area (NPA) trends Old Value of ratio of NPA to NH atr=0.24 • New determined equation by linear regression • With ar=1.62 for 1875-2008 • Withar=1.45 for 1901-2008
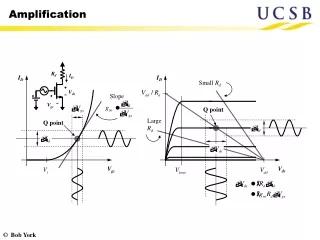
Why is this term better? • First Graph: Black boxes= arand bars=atr. Much larger, more unpredictable spread of atr over ar. • Second Graph: relationship between NH and NPA SAT trends. Notice NPA (vertical axis) is twice that of NH (horizontal axis). • Third Graph: Standard Deviations show that ar (blue line) is much more of a stable estimate than atr (black line). • Fourth Graph: trend between NPA SAT’s on the vertical axis and NH SAT’s on the horizontal axis. Notice how the model is very steady over long period of time. 42 CMIP model runs
Fun Fact • Blue dots = before industrial period. • Red dots = during and after industrial period • Based on this new model, Polar Amplification is apart of climate no matter with or without human interactions. • Look at steadiness before and after human factors were put into play. • Polar amplification will happen as a result of natural or human caused warming events.
Seasonal PA Left: ratio between NPA and NH SAT trends. Higher arvalues= correspond to higher NPA temperatures relative to NH temperatures. Seasonal Max’s Seasonal Max’s: Spring and Autumn Autumn: ice albedo feedback is responsible Spring: a number of other positive feedbacks, such as the snow albedo feedback, and changes in turbulent forcing and longwave radiation
Local Polar Amplification • When say local, they refer to as Arctic based scale. • PA at the local level is mostly a result of ice-albedo feedback • Effect should be seen mostly in autumn and early winter as increased ice melt in the summer leads to more ocean water being exposed, leading to an increase in ocean temperatures, further leading to more ice melt.
BEKRYAEV was like “Nah Uh” • My paper found that recently, the warming in the NPA has been much more uniform than what should be if ice-albedo dominated. • Over long period of time, even warming was more in winter and spring than in autumn.
So What does this all mean • ????
Conclusions • The ice-albedo feedback doesn’t wholly explain the large ice reduction and climb in NPA SAT’s in the past few decades. • Paper cites data from another's research (Ogi and Wallace (2007)) that states that the ice-albedo feedback is only responsible for around 15 percent of the polar amplification that is taking place. • Because of the uncertainty regarding feedbacks like the water vapor and cloud feedbacks as well as the fact that any anthropogenic warming may be masked by the natural variability. • Warming rate for high latitudes 1875-2008 was 1.36 degrees C/century and for the past decade,1.35 degrees C/decade. • Came up with a new term to define the ratio of NPA to NH SAT’s, ar.
Citations • B EKRYAEV ET AL • "RealClimate: Polar Amplification." RealClimate RSS. N.p., n.d. Web. 04 Apr. 2014.