Download
1 / 46
460 likes | 655 Views
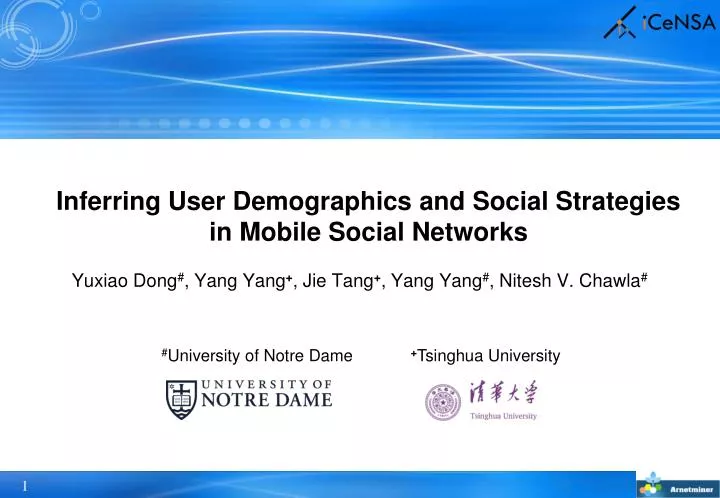
Inferring User Demographics and Social Strategies in Mobile Social Networks. Yuxiao Dong # , Yang Yang + , Jie Tang + , Yang Yang # , Nitesh V. Chawla #. # University of Notre Dame. + Tsinghua University.

E N D
Inferring User Demographics and Social Strategiesin Mobile Social Networks Yuxiao Dong#, Yang Yang+, Jie Tang+, Yang Yang#, Nitesh V. Chawla# #University of Notre Dame +Tsinghua University
Yuxiao Dong, Yang Yang, Jie Tang, Yang Yang, Nitesh V. Chawla. Inferring User Demographics and Social Strategies in Mobile Social Networks. KDD 2014. male Did you know: As of 2014, there are7.3billion mobile phones, larger than the global population. Users average 22calls, 23messages, and 110 status checks per day. More stable Fewer friends female Younger Older 2x more social friends 4x more opposite-gender circles have than
Big Mobile Data • Real-world large-scale mobile data • An anonymous country. • No communication content. • Aug. 2008 – Sep. 2008. • > 7 million mobile users + demographic information. • Gender: Male (55%) / Female (45%) • Age: Young (18-24) / Young-Adult (25-34) / Middle-Age (35-49) / Senior (>49) • > 1 billion communication records (call and message). • Two networks:
What We Do • How do people communicate / interact with each other with mobile phones? • Infer human social strategies on demographics. • To what extent can user demographic profiles be inferred from their mobile communication interactions? • Infer user demographics based on social strategies. • Applications: • Viral marketing • Personalized services • User modeling • Customer churn warning • …
Infer human social strategies on demographics user demographics + mobile social network social strategies
Social Strategy • Human needs are defined according to the existential categories of being, having, doing, and interacting[1]. Two basic human needs[2] are to • Meet new people Social needs. • Strengthen existing relationships Social needs. • Social strategies are used by people to meet social needs. • Humanneeds are constant across historical time periods. • However, the strategies by which these needs are satisfied change over time[1,3]. • Barabasi and Dunbar[3]: • “Women are more focused on opposite-sex relationships than men during the reproductively active period of their lives.” … “As women age, their attention ships from their spouse to younger females---their daughters.” • “Human social strategieshave more complex dynamics than previously assumed.” • http://en.wikipedia.org/wiki/Fundamental_human_needs • M.J. Piskorski. Social strategies that work. Harvard Business Review. Nov. 2011. • V. Palchykov, K. Kaski, J. Kertesz, A.-L. Barabasi, R. I. M. Dunbar. Sex differences in intimate relationships. Scientific Reports 2012.
Social Strategy • We study demographic-based social strategy with respect to the micro-level network structures. • Ego network • Social tie • Social triad Female Male
Social Strategy: Ego Network Correlations between user demographics and network properties.
Social Strategy: Ego Network 2 times 2 times Correlations between user demographics and network properties. Social Strategies: Young people are active in broadening their social circles, while seniors have the tendency to maintain small but close connections.
Social Strategy: Ego Network In your mobile phone contact list, do you have more female or male friends?
Social Strategy: Ego Network Female friends’ age X: age of central user. Y: age of friends. Positive Y: female friends; Negative Y: male friends; Spectrum: distribution Male friends’ age Social Strategies: People tend to communicate with others of both similar gender and age, i.e., demographic homophily.
Social Strategy: Social Tie How frequently do you call your mother vs. your significant other? • “Social networks based on dyadic relationships are fundamentally important for understanding of human sociality.”[1] • Social tie strength is defined by the frequency of communications (calls, messages)[2].
Social Strategy: Social Tie X: age of one user. Y: age of the other user. Spectrum: #calls per month (a), (b), (c) are symmetric.
Social Strategy: Social Tie N X: age of one user. Y: age of the other user. Spectrum: #calls per month (a), (b), (c) are symmetric. M P Q M,N,P,Q: 10~15 calls per month are made between parents and children. Social Strategies: Frequent cross-generation interactions are maintained to bridge age gaps.
Social Strategy: Social Tie X: age of one user. Y: age of the other user. Spectrum: #calls per month (a), (b), (c) are symmetric. E “Brother” phenomenon E vs. F: E: Male:±5 yearsold interactions F: Female: only same-age interactions. F Social Strategies: Young male maintain more frequent and broader social connections than young females.
Social Strategy: Social Tie X: age of one user. Y: age of the other user. Spectrum: #calls per month (a), (b), (c) are symmetric. E E,F vs. G: G: f-m: >30 calls per months E/F: m-m or f-f: 10~15 calls G F Social Strategies: Opposite-gender interactions are much more frequent than those between young same-gender users.
Social Strategy: Social Tie X: age of one user. Y: age of the other user. Spectrum: #calls per month (a), (b), (c) are symmetric. H H,I vs. J: I J Social Strategies: When people become mature, reversely, same-gender interactions are more frequent than those between opposite-gender users.
Social Strategy: Social Triad • Social triad is one of the simplest grouping of individuals that can be studied and is mostly investigated by microsociology[1]. How do people maintain their social triadic relationships across their lifetime? D. Easley, J. Kleinberg. Networks, Crowds, and Markets: Reasoning About a Highly Connected World. Cambridge U. Press. 2010
Social Strategy: Social Triad X: minimum age of 3 users. Y: maximum age of 3 users. Spectrum: distribution
Social Strategy: Social Triad X: minimum age of 3 users. Y: maximum age of 3 users. Spectrum: distribution M N M,N,P,Q: Intense red areas P Q Social Strategies: People expand both same-gender and opposite-gender social groups during the dating and reproductively active period.
Social Strategy: Social Triad X: minimum age of 3 users. Y: maximum age of 3 users. Spectrum: distribution F E E,H vs. F,G: #same-gender triads are ~6 times more than #opposite-gender triads. G H Social Strategies: People’s attention to opposite-gender groups quickly disappears, and the insistence and social investment on same-gender social groups lasts for a lifetime.
Infer user demographicsbased on social strategies social strategies + mobile social network user demographics
Problem: Demographic Prediction • Gender or Age Classification • Infer users’ gender Y and age Z separately. • Model correlations between gender Y and attributes X; • Model correlations between age Z and attributes X; Input: G = (VL, VU, E, YL), X Output: f(G, X)(YU) Miss the interrelation between Y and Z ! Input: G = (VL, VU, E, ZL), X Output: f(G, X)( ZU)
Problem: Demographic Prediction • Double Dependent-Variable Classification • Infer users’ gender Y and age Zsimultaneously. • Model correlations between gender Y and attributes X; • Model correlations between age Z and attributes X; • Model interrelations between Y and Z; • Gender: • Male (55%) / Female (45%) • Age: • Young (18-24) / Young-Adult (25-34) / Middle-Age (35-49) / Senior (>49) Input: G = (VL, VU, E, YL, ZL), X Output: f(G, X)(YU, ZU)
WhoAmI Method---A double dependent-variable factor graph Modeling social strategies on social triad Modeling social strategies on social tie Triadic factor h() Dyadic factor g() Modeling interrelations between gender and age Random variable Z: Age Random variable Y: Gender Attribute factor f() Modeling social strategies on social ego Joint Distribution: Code is available at: http://arnetminer.org/demographic
WhoAmI: Model Initialization Joint Distribution: Attribute factor: Interrelations between gender Y & age Z Dyadic factor: Triadic factor: Code is available at: http://arnetminer.org/demographic
WhoAmI: Objective Function Objective function: Model learning: gradient descent Circles?LBP[1] • K. P. Murphy, Y. Weiss, M. I. Jordan. Loopy Belief Propagation for Approximate Inference: An Empirical Study. UAI’99. Code is available at: http://arnetminer.org/demographic
Experiment • Data: active users (#contacts >=5 in two months) • >1.09 million users in CALL • >304 thousand users in SMS • 50% as training data • 50% as test data
Experiment • Baselines: • LRC: Logistic Regression • SVM: Support Vector Machine • NB: Naïve Bayes • RF: Random Forest • BAG: Bagged Decision Tree • RBF: Gaussian Radial Basis Function Neural Network • FGM: Factor Graph Model • DFG: WhoAmI: Double Dependent-Variable Factor Graph
Experiment • Evaluation Metrics: • Weighted Precision • Weighted Recall • Weighted F1 Measure • Accuracy
Experiment The proposed WhoAmI (DFG) outperforms baselines by up to 10% in terms of F1. We can infer 80% of the users’ GENDER in the CALL network correctly. The CALL behaviors reveal more users’ GENDER information than SMS. We can infer 73% of the users’ AGE in the SMS network correctly. The SMS behaviors reveal more users’ AGE information than CALL.
Experiment: Results DFG-d: stands for ignoring the interrelations between gender and age. DFG-df: stands for further ignoring tie features. DFG-dc: stands for further ignoring triad features. DFG-dcf: stands for further ignoring tie and triad features. The positive effects of interrelations between gender and age. Social Triad features are more powerful for inferring users’ gender. Social Tie features are more powerful for inferring users’ age.
Conclusion • Unveil the demographic-based social strategies used by people to meet their social needs: • Propose WhoAmI, a Double Dependent-Variable Factor Graph, for inferring users’ genders and ages simultaneously. • Demonstrate the proposed WhoAmI method in a large-scale mobile social network. male More stable Fewer friends female Younger Older
Acknowledgements • Army Research Laboratory • U.S. Air Force Office of Scientific Research (AFOSR) and the Defense Advanced Research Projects Agency (DARPA) • National High-Tech R&D Program • Natural Science Foundation of China • National Basic Research Program of China
Thank You! Inferring User Demographics and Social Strategiesin Mobile Social Networks Yuxiao Dong#, Yang Yang+, Jie Tang+, Yang Yang#, Nitesh V. Chawla# #University of Notre Dame +Tsinghua University Code is available at: http://arnetminer.org/demographic
Big Network Data • 1.26 billion users • 700 billionminutes/month • 280 million users • 80% of usersare 80-90’s • 555 million users • .5 billion tweets/day • 560 million users • influencing our daily life • 79 million users per month • 9.65 billionitems/year • 800 million users • ~50% revenue fromnetwork life • 500 million users • 35 billionon 11/11
Big Network Data • 1.26 billion users • 700 billionminutes/month • 280 million users • 80% of usersare 80-90’s $19 billion acquisition Feb. 2014 • 555 million users • .5 billion tweets/day • 560 million users • influencing our daily life • 79 million users per month • 9.65 billionitems/year • 800 million users • ~50% revenue fromnetwork life • 500 million users • 35 billionon 11/11
Big Mobile Network Data • 1.26 billion users • 700 billionminutes/month • 280 million users • 80% of usersare 80-90’s • 555 million users • .5 billion tweets/day • 560 million users • influencing our daily life • 7.3 billion mobile devices in 2014[1] • >100% of global population • 79 million users per month • 9.65 billionitems/year • 800 million users • ~50% revenue fromnetwork life • 500 million users • 35 billionon 11/11 1. http://www.itu.int/International Telecommunications Union (ITU) at 2013 Mobile World Congress.
Big Mobile Network Data • In 2013, 97% of adults have a mobile phone in the US[1] • made 3 billion phone calls per day • sent 6 billion text messages per day • This talk (15 mins): • 21 million calls & 42 million messages • On average, in one day each mobile user in the US[2] • makes, receives or avoids 22 phone calls • sends or receives text messages 23 times • checks her/his phone 110 times. http://www.accuconference.com/blog/Cell-Phone-Statistics.aspx http://www.dailymail.co.uk/news/article-2276752/Mobile-users-leave-phone-minutes-check-150-times-day.html
Related work • Previous work on mobile social networks mainly focuses on macro-level models[1,2]. • No Demographics. • Reality Mining[3] • The friendship network of 100 specific users (student of faculty in MIT). • Demographics + Human interactions. • The 2012 Nokia Mobile Data Challenge[4] • Infer user demographics by using communication records of 200 users. J.P. Onnela, J. Saramaki, J. Hyvonen, G. Szabo, D. Lazer, K. Kaski, J. Kertesz, A.-L. Barabasi. Structure and tie strengths in mobile communication networks. PNAS 2007. M. Seshadri, S. Machiraju, A. Sridharan, J. Bolot, C. Faloutsos, J. Leskovec. Mobile call graphs: Beyond power-law and lognormal distributions. KDD’08. http://realitycommons.media.mit.edu/ https://research.nokia.com/page/12000
WhoAmI: Distributed Learning Master Global update Slave Compute local gradient via random sampling Graph Partition by Locations Master-Slave Computing Inevitable loss of correlation factors! Jie Tang, Sen Wu, Jimeng Sun. Confluence: Conformity influence in large social networks. KDD’13.
Experiment: Features • Given one node v and its ego network: • Individual feature: • Individual attribute: degree, neighbor connectivity, clustering coefficient, embeddedness and weighted degree. • Friend feature: • Friend attribute: # of connections to female/male, young/young-adult/middle-age/senior friends (from labeled friends). • Dyadic factor: both labeled and unlabeled friends for social tie structures in v’s ego network. • Circle feature: • Circle attribute: # of demographic triads, i.e., v-FF, v-FM, v-MM; v-AA, v-AB, v-AC, v-AD, v-BB, v-BC, v-BD, v-CC, v-CD, v-DD. (A/B/C/C denote the young/young-adult/middle-age/senior) • Triadic factor: both labeled and unlabeled friends for social triad structures in v’s ego network. • LCR/SVM/NB/RF/Bag/RBF: • Individual/Friend/Circle Attributes • FGM/DFG • Individual/Friend/Circle Attributes • Structure feature: Dyadic factors • Structure feature: Triadic factors ? ? ? ? V-fm V-FF
Experiment: Results Gender Age Performance of demographic prediction with different percentage of labeled data
Social Strategy: Ego Network same-generation friends Social Strategies: The young put increasing focus on the same generation, but decrease it after entering middle-age.
Social Strategy: Ego Network same-generation friends older-generation friends Social Strategies: The young put decreasing focus on the older generation across their lifespans.
Social Strategy: Ego Network same-generation friends older-generation friends younger-generation friends Social Strategies: The middle-age people devote more attention on the younger generation even along with the sacrifice of homophily.