Download
1 / 1
10 likes | 96 Views
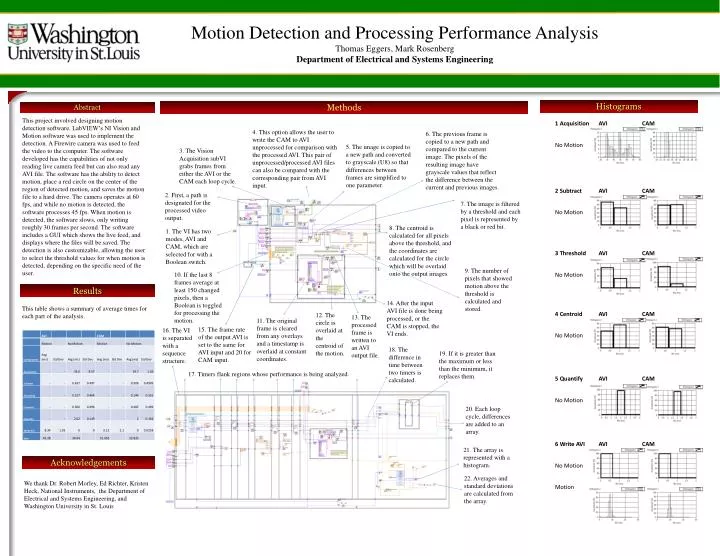
Motion Detection and Processing Performance Analysis Thomas Eggers, Mark Rosenberg Department of Electrical and Systems Engineering. Histograms. Methods. Abstract.

E N D
Motion Detection and Processing Performance AnalysisThomas Eggers, Mark Rosenberg Department of Electrical and Systems Engineering Histograms Methods Abstract This project involved designing motion detection software. LabVIEW’s NI Vision and Motion software was used to implement the detection. A Firewire camera was used to feed the video to the computer. The software developed has the capabilities of not only reading live camera feed but can also read any AVI file. The software has the ability to detect motion, place a red circle on the center of the region of detected motion, and saves the motion file to a hard drive. The camera operates at 60 fps, and while no motion is detected, the software processes 45 fps. When motion is detected, the software slows, only writing roughly 30 frames per second. The software includes a GUI which shows the live feed, and displays where the files will be saved. The detection is also customizable, allowing the user to select the threshold values for when motion is detected, depending on the specific need of the user. 4. This option allows the user to write the CAM to AVI unprocessed for comparison with the processed AVI. This pair of unprocessed/processed AVI files can also be compared with the corresponding pair from AVI input. 6. The previous frame is copied to a new path and compared to the current image. The pixels of the resulting image have grayscale values that reflect the difference between the current and previous images. 5. The image is copied to a new path and converted to grayscale (U8) so that differences between frames are simplified to one parameter. 3. The Vision Acquisition subVI grabs frames from either the AVI or the CAM each loop cycle. 2. First, a path is designated for the processed video output. 7. The image is filtered by a threshold and each pixel is represented by a black or red bit. 8. The centroid is calculated for all pixels above the threshold, and the coordinates are calculated for the circle which will be overlaid onto the output images. 1. The VI has two modes, AVI and CAM, which are selected for with a Boolean switch. 9. The number of pixels that showed motion above the threshold is calculated and stored. 10. If the last 8 frames average at least 150 changed pixels, then a Boolean is toggled for processing the motion. Results 14. After the input AVI file is done being processed, or the CAM is stopped, the VI ends. This table shows a summary of average times for each part of the analysis. 12. The circle is overlaid at the centroid of the motion. 13. The processed frame is written to an AVI output file. 11. The original frame is cleared from any overlays and a timestamp is overlaid at constant coordinates. 15. The frame rate of the output AVI is set to the same for AVI input and 20 for CAM input. 16. The VI is separated with a sequence structure. 18. The difference in time between two timers is calculated. 19. If it is greater than the maximum or less than the minimum, it replaces them. 17. Timers flank regions whose performance is being analyzed. 20. Each loop cycle, differences are added to an array. 21. The array is represented with a histogram. Acknowledgements 22. Averages and standard deviations are calculated from the array. We thank Dr. Robert Morley, Ed Richter, Kristen Heck, National Instruments, the Department of Electrical and Systems Engineering, and Washington University in St. Louis